What had given Inflation Hysteria #1 its real punch had been the benchmark 10-year Treasury note. Throughout 2017, despite the unemployment rate in the US, globally synchronized growth being declared around the world (and being declared as some momentously significant development), and whatever other tiny factors acceding to the narrative, longer-term Treasury rates just weren’t buying it. Instead, the eurodollar monetary system continued to cling to these safest, most liquid instruments through nearly the whole year. Nearly. The 5-year UST yield started to perk up in September 2017, but it was the 10s – and when – which really drove Reflation #3’s final insanity to truly hysterical proportions. Once the Tax Cuts & Jobs Act of 2017 made it through Congress and
Topics:
Jeffrey P. Snider considers the following as important: 5.) Alhambra Investments, bonds, currencies, Dollar, economy, Featured, Federal Reserve/Monetary Policy, inflation, Markets, newsletter, nominal yields, U.S. Treasuries
This could be interesting, too:
Nachrichten Ticker - www.finanzen.ch writes Die Performance der Kryptowährungen in KW 9: Das hat sich bei Bitcoin, Ether & Co. getan
Nachrichten Ticker - www.finanzen.ch writes Wer verbirgt sich hinter der Ethereum-Technologie?
Martin Hartmann writes Eine Analyse nach den Lehren von Milton Friedman
Marc Chandler writes March 2025 Monthly
| What had given Inflation Hysteria #1 its real punch had been the benchmark 10-year Treasury note. Throughout 2017, despite the unemployment rate in the US, globally synchronized growth being declared around the world (and being declared as some momentously significant development), and whatever other tiny factors acceding to the narrative, longer-term Treasury rates just weren’t buying it. Instead, the eurodollar monetary system continued to cling to these safest, most liquid instruments through nearly the whole year.
Nearly. The 5-year UST yield started to perk up in September 2017, but it was the 10s – and when – which really drove Reflation #3’s final insanity to truly hysterical proportions. Once the Tax Cuts & Jobs Act of 2017 made it through Congress and all its pitfalls and political stunts, this “massive” act of dollar “destroying” “stimulus” finally moved the longer-dated Treasury market off its inflation-defying spots. Nominal yields rose and did so, for a short time, rather quickly. |
UST Yield Curve, 2017-2018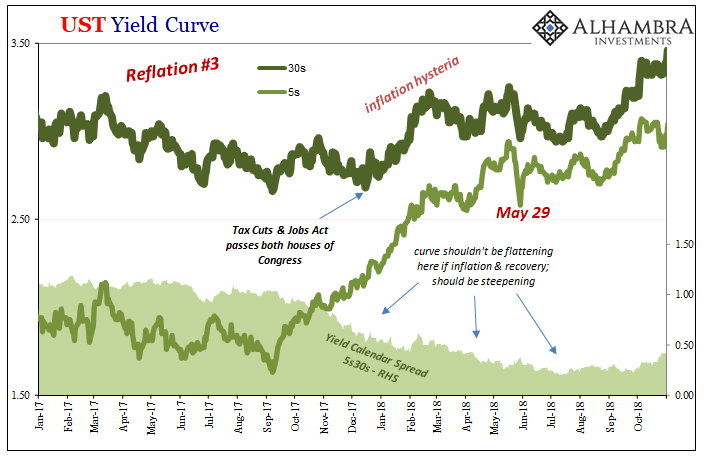 - Click to enlarge |
| There’s always an important distinction between the 5s and the 10s; temporary or transitory influences can bake and fake the inner stuff, including what the Federal Reserve does under its own mistaken assumptions (such as “rate hikes”). Outside the belly, into the 7s on into the benchmark 10s and beyond, that’s much more about how this key market views the consequences for what’s going on in the current situation.
Probability spectrums for what happens down the road given underlying fundamentals and any perceived changes in them. Thus, outwardly it seemed like TCJA really had been the game-changer everyone was saying it would be. Finally! The 10s joined the inflationary fire! Except, no. Like inflation expectations in TIPS or swap spreads discussed earlier, what really had happened was a very modest, ultimately temporary shift in recognized overall probabilities. Maybe the TCJA could have some effect, but by and large the market (nominal, UST, swaps, eurodollar futures, etc.) wasn’t at all radically discounting the deflationary baseline in effect since August 2007. |
UST Yield Curve, 2003-2020 - Click to enlarge |
| Consistent with that age, however, this molehill of a tiny selloff was transformed into the catalytic mountain for Inflation Hysteria #1. Interest rates had nowhere to go but up, up, and away, they all confidently declared, especially as the benchmark 10-year yield reached its own highest-in-years levels.
Even on its own nominal terms, though, the yield curve shape was denying this narrative interpretation. The flattening curve represented serious and growing skepticism; which, ultimately, proved to be the correct call. As nominal yields gained during the balance of 2018, this flattening (and already-inverted eurodollar futures) was indicating growing probabilities of another deflationary – rather than the first inflationary – outbreak. The bond market never once really shifted off its underlying mantra: the global economy always more likely to sour than soar. In late 2017, that was still the case in the bond market, if only slightly less potentially sour and a tiny bit more toward soar. Nowhere near some categorical change in outlook. |
UST Yield Curve, 2020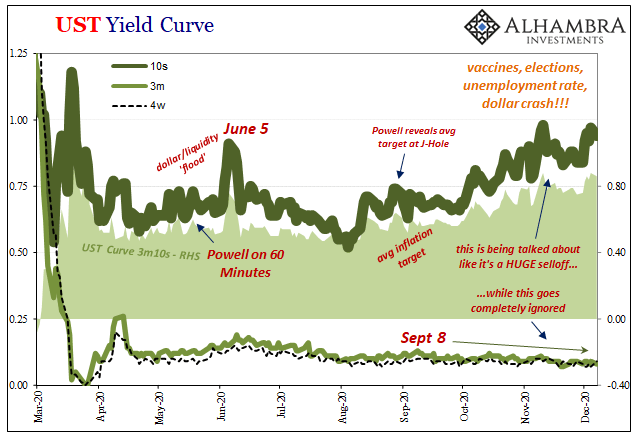 - Click to enlarge |
| And now, here we are all over again. Only this time the 2017 TCJA molehill is a mountain compared to the vaccine-dollar-crash-whatever-they’ll-call-CARES-ACT-II barely visible lump.
Yep, Treasury yields are a little higher than they were more recently. It still doesn’t come close to projecting inflationary fire and the dollar’s devastating collapse. Far from it, there’s an order of magnitude more sour today than even the most hysterical points of 2017-18. Just like 2017, even easier than 2017, it’s not all that difficult to figure out why. |
Pro forma CES Private Payrolls, 2020-2021 - Click to enlarge |
You Might Also Like
 Why Aren’t Bond Yields Flyin’ Upward? Bidin’ Bond Time Trumps Jay
2020-10-02
It’s always something. There’s forever some mystery factor standing in the way. On the topic of inflation, for years it was one “transitory” issue after another. The media, on behalf of the central bankers it holds up as a technocratic ideal, would report these at face value. The more obvious explanation, the argument with all the evidence, just couldn’t be true otherwise it’d collapse the technocracy right down to the ground.And so it was also in the bond market. Inflation and their yields very much related, the lack of the former wasn’t ever used to explain the curious absence of the BOND ROUT!!! No, the US Treasury market has been beset by its own set of “transitory” factors, too. As ridiculous as some of the inflation excuses had been, Verizon’s unlimited wireless data plans the
 Fama 2: No Inflation For Old Central Banks
2020-08-14
The Bureau of Labor Statistics reported that the core CPI in July 2020 jumped by the most (+0.62%) in almost thirty years. After having dropped month-over-month for three months in a row for the first time in its history, it has posted back to back gains the latest of which pushing the index back above its February level.
 Part 2 of June TIC: The Dollar Why
2020-08-21
Before getting into the why of the dollar’s stubbornly high exchange value in the face of so much “money printing”, we need to first go back and undertake a decent enough review of the guts maybe even the central focus of the global (euro)dollar system.
 Powell Would Ask For His Money Back, If The Fed Did Money
2020-09-05
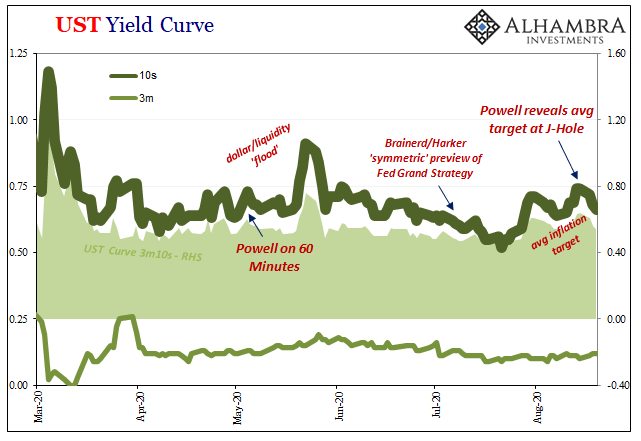
Since the unnecessary destruction brought about by GFC2 in March 2020, there have been two detectable, short run trendline upward moves in nominal Treasury yields. Both were predictably classified across the entire financial media as the guaranteed first steps toward the “inevitable” BOND ROUT!!!!
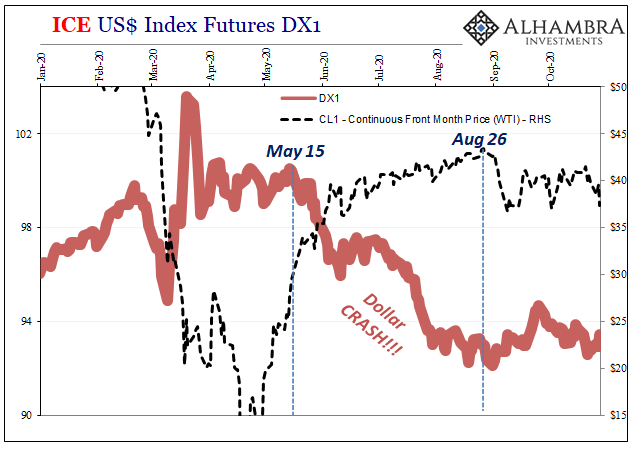 What’s Going On, And Why Late August?
2020-10-29
This isn’t about COVID. It’s been building since the end of August, a shift in mood, perception, and reality that began turning things several months before even then. With markets fickle yet again, a lot today, what’s going on here?
 Not This Again: Too Many Treasuries?
2020-08-27
Tomorrow, the Treasury Department is going to announce the results of its latest bond auction. A truly massive one, $47 billion are being offered of CAH4’s notes dated August 31, 2020, maturing out in August 31, 2027. In other words, the belly of the belly, the 7s.We’ve already seen them drop for two note auctions this week, both equally sizable.
 Reopening Inertia, Asian Dollar Style (Still Waiting On The Crash)
2020-09-20
Why are there still outstanding dollar swap balances? It is the middle of September, for cryin’ out loud, and the Federal Reserve reports $52.3 billion remains on its books as of yesterday.
 Meanwhile, Outside Today’s DC
2020-11-05
With all eyes on Washington DC, today, everyone should instead be focused on Europe. As we’ve written for nearly three years now, for nearly three years Europe has been at the unfortunate forefront of Euro$ #4. We could argue about whether coming out of GFC2 back in March pushed everything into a Reflation #4 – possible – or if this is still just one three-yearlong squeeze of a global dollar shortage.
Tags: Bonds,currencies,dollar,economy,Featured,Federal Reserve/Monetary Policy,inflation,Markets,newsletter,nominal yields,U.S. Treasuries