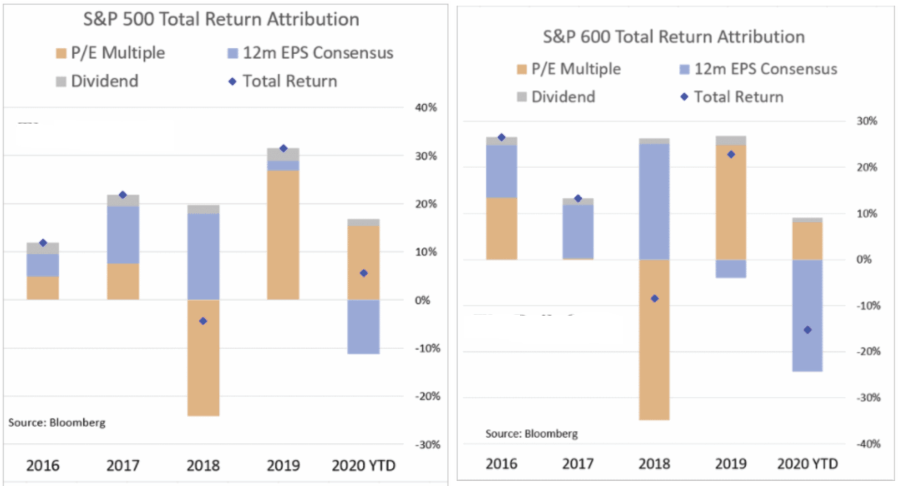
In 2019, we wrote about how corporate share repurchases, or “stock buybacks,” had accounted for nearly all buying in the market. A year later, that significant support for asset prices has reversed. While markets have certainly been on a tear this year, due to massive amounts of Federal Stimulus, it has been an advance solely on valuation expansion. While the decline in 2020 earnings was no surprise given the pandemic, earnings were already declining in 2019. The chart shows this in the return attribution of the S&P 500. Notably, while investors are willing to “pay more for less” in earnings, revenue growth deteriorated more. . Overpaying For Earnings Such is not a new phenomenon. Since 2009, sales per share, what happens at the top of the income statement,
Topics:
Lance Roberts considers the following as important: 9.) Real Investment Advice, 9) Personal Investment, Featured, Investing, newsletter
This could be interesting, too:
Nachrichten Ticker - www.finanzen.ch writes Die Performance der Kryptowährungen in KW 9: Das hat sich bei Bitcoin, Ether & Co. getan
Nachrichten Ticker - www.finanzen.ch writes Wer verbirgt sich hinter der Ethereum-Technologie?
Martin Hartmann writes Eine Analyse nach den Lehren von Milton Friedman
Marc Chandler writes March 2025 Monthly
|
In 2019, we wrote about how corporate share repurchases, or “stock buybacks,” had accounted for nearly all buying in the market. A year later, that significant support for asset prices has reversed. While markets have certainly been on a tear this year, due to massive amounts of Federal Stimulus, it has been an advance solely on valuation expansion. While the decline in 2020 earnings was no surprise given the pandemic, earnings were already declining in 2019. The chart shows this in the return attribution of the S&P 500. Notably, while investors are willing to “pay more for less” in earnings, revenue growth deteriorated more. |
 . |
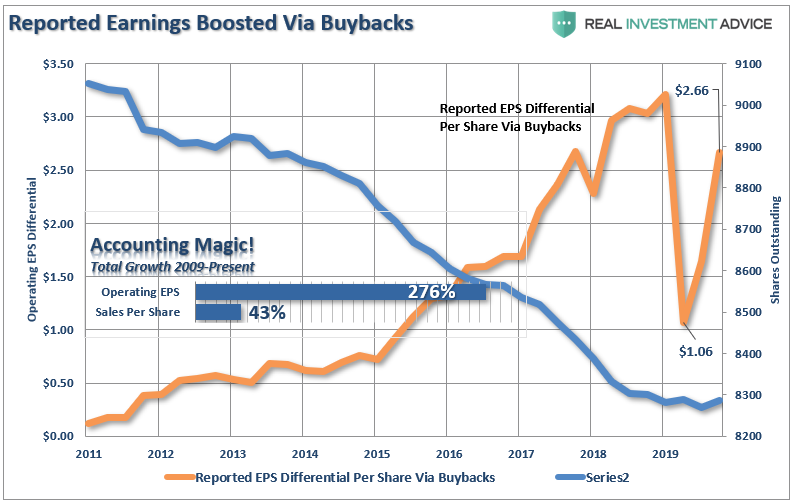
Overpaying For EarningsSuch is not a new phenomenon. Since 2009, sales per share, what happens at the top of the income statement, has cumulatively grown by just 43% through Q3-2020. It is hard to justify bidding up stocks by 400% based on meager revenue growth. So, Wall Street created metrics like “Operating Earnings” to provide justification. The problem with “Operating Earnings” is they are heavily “fudged” to create a more optimistic picture.
What is more surprising though is CFOs’ belief these practices leave a significant mark on companies’ reported profits and losses. When asked about the magnitude of the earnings misrepresentation, the study’s respondents said it was around 10% of earnings per share.“ |
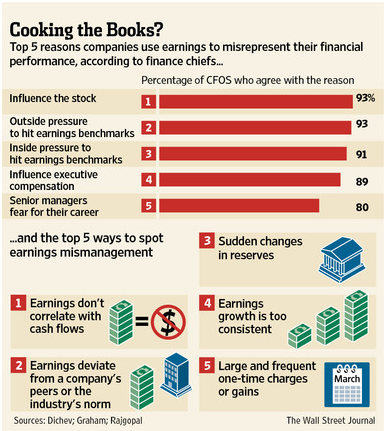 |
| The reason companies do this is simple: stock-based compensation. Today, more than ever, corporate executives have a large percentage of their compensation tied to stock performance. A “miss” of Wall Street expectations can lead to a large penalty in the companies stock price.
In a survey conducted with corporate executives, 93% of the respondents pointed to “influence on stock price” and “outside pressure” as the reason for manipulating earnings figures. A Buyback BoostThe use of stock buybacks has continued to rise in recent years and went off the charts following tax cuts in 2017. As I wrote in early 2018. most thought tax cuts would lead to rising capital investment, higher wages, and economic growth. However, it went where we expected it would. To wit:
The heavy use of buybacks turned cumulative revenue growth of 43% into a 276% gain in operating earnings. |
 . |
| To gain a better perspective on the real growth of corporations’ profitability over the last decade, just look at corporate profits after tax. These are the profits reported to the IRS for tax purposes and includes all the write-offs, expenses, and other items. Considering profits didn’t grow from 2014-2019 and then collapsed to 2010 levels in 2020, it is hard to justify current valuations.
However, while retail investors are piling into stocks, the corporate executives are cashing out. |
 . |
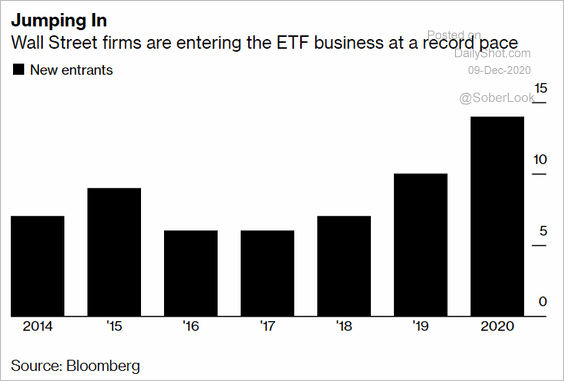
Insiders Cashing OutOne can not argue the changing dynamics of the market from “passive indexing.” Currently, the new “gold rush” on Wall Street is to issue “exchange-traded funds,” also known as a “product,” to meet retail investor demands. (Also known as “dumb money.”) |
 . |
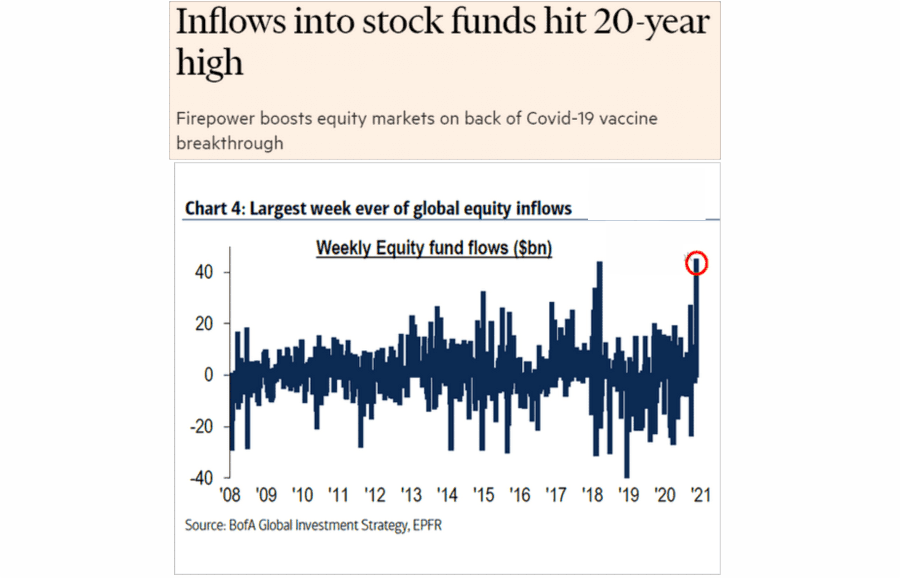
| As retail investors’ exuberance to take on more risk increases, they push more money into equity-based funds. Currently, we are back to levels seen before the 20% decline in 2018. Importantly, as money flows into these funds, the underlying company stock prices rise. |
 . |
| This all aligns with SentimenTrader’s “Dumb Money” index hitting the highest levels in history. |
 . |
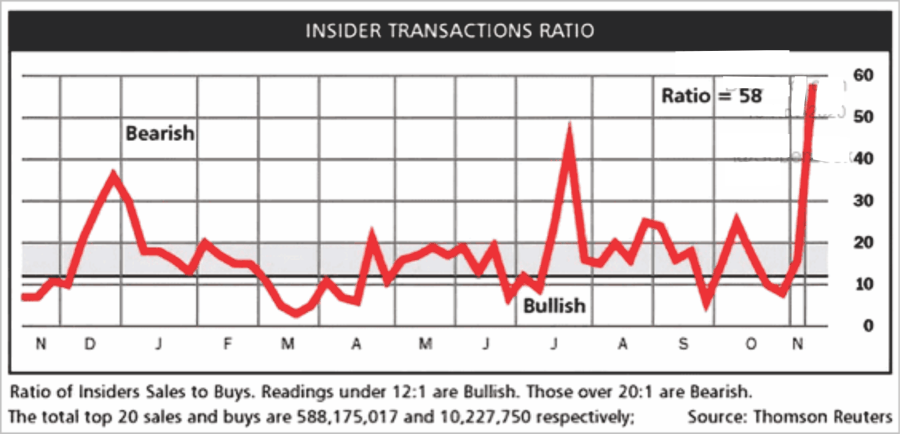
| Therefore, it should be of no surprise that corporate executives, who, as noted, have large exposures to stock-based compensation, are “cashing out.”
If the “executives” are cashing out while you are rushing in, maybe ask what they know that you don’t. Such brings us to the main point of our analysis. |
 . |
share buybacks. As discussed previously in “Peak Buybacks:”
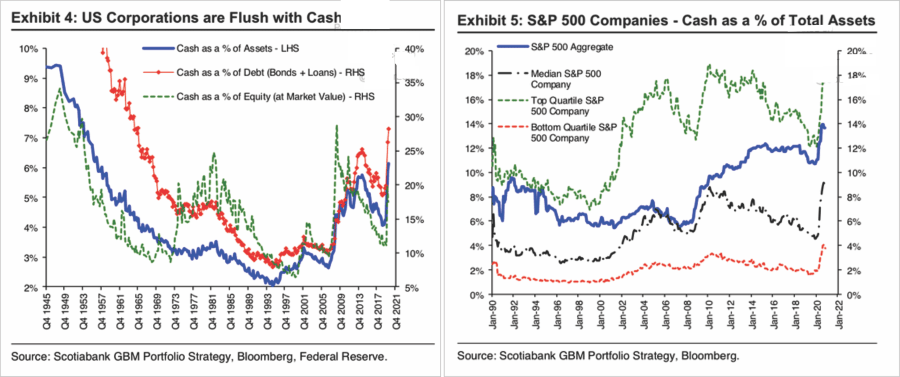
Both pushed up asset prices.’ Between the Fed injecting massive amounts of liquidity, and corporations buying back shares, there have been no other real buyers in the market.” Hoarding CashBut here is the crucial point we made last September in that article:
|
 . |
The Problem Of DebtCorporations also have another problem. Over the last several years, debt was the funding source for a large chunk of the share buybacks completed. As Goldman Sachs noted in 2019, an analysis of corporate balance sheets found that dividend and stock buybacks accounted for 103.8% of their free cash flow. Meaning they were paying more out in cash |
 . |
| As Goldman Sachs noted in 2019, an analysis of corporate balance sheets found thasing their cash hoards and issuing debt, they are taking advantage of investors’ “irrational exuberance” to sell shares into the market. The outcome is the same. There is less corporate demand underlying the financial markets.
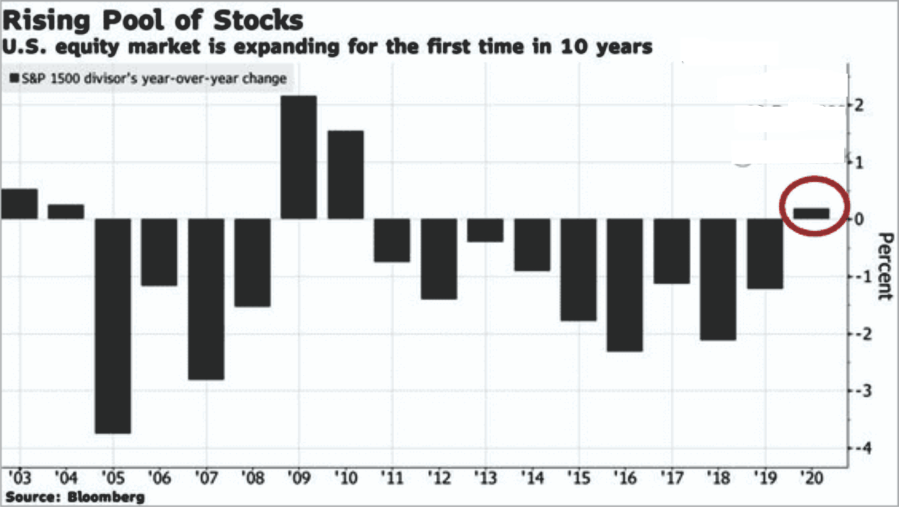
Review the chart above that showed nearly all of the previous equity buying came from corporations. Corporations have now switched by markedly decreasing share buybacks from the 2015-2019 levels. Now they are beginning to increase outstanding shares. Notably, over the last 20-years, the only two previous periods |
 . |
| nted for 103.8% of their free cash flow. Meaning they were paying more out in cash than they had on hand.
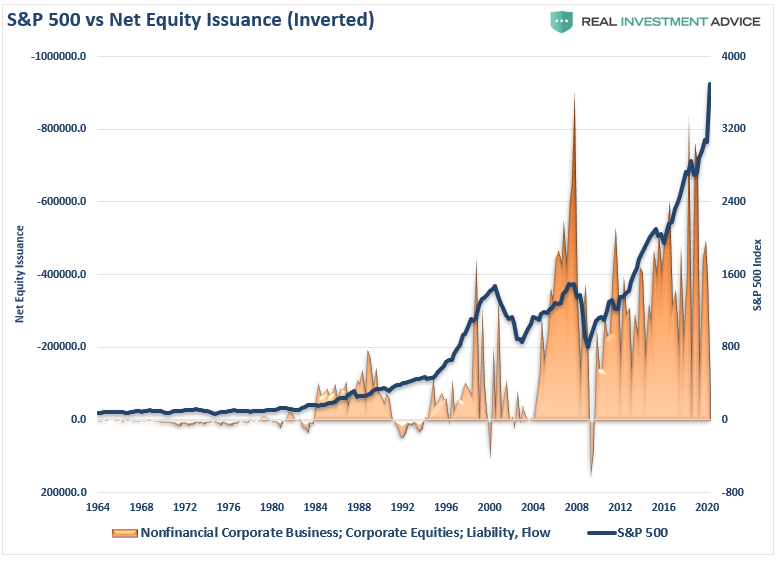
The chart below compares the total amount of corporate debt issued versus the reduction in the number of shares. |
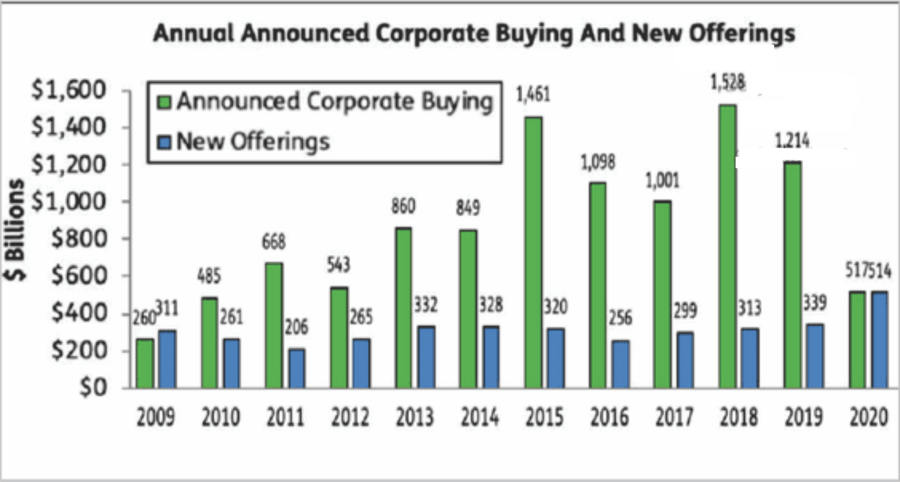 . |
| It shouldn sheets found that dividend and stock buybacks accounted for 103.8% of their free cash flow. Meaning they were paying more out in cash than they had on hand.
The chart below compares the total amount of corporate debt issued versus the reduction in the number of shares. It shouldn’t be surprising to see that when corporations have previously been “net issuers” of stocks versus “buyers,” asset markets have not performed well. |
 . |
| The explosion of corpoth the current debt-to-GDP ratio even higher today than before the “pandemic,” the trap has grown.
Such is something Dallas Fed President Robert Kaplan |
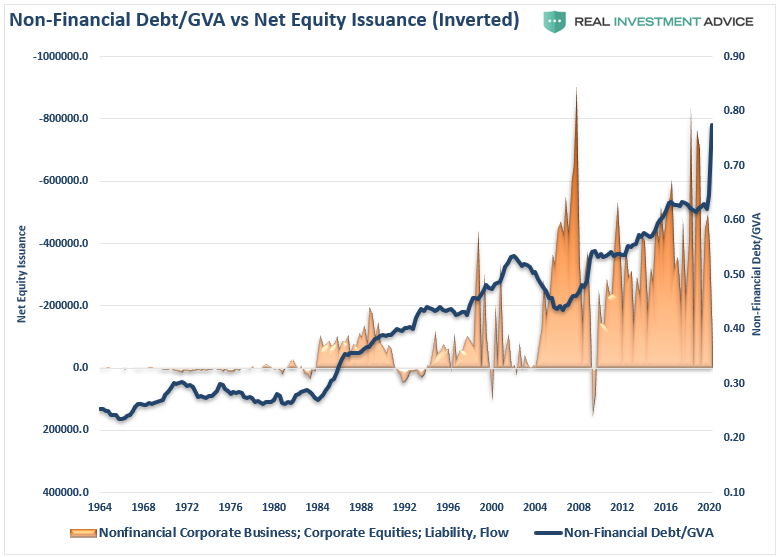 . |
| As asset prices decrease, many companies become unable to refinance their debt, or worse, forced to liquidate. With the current debt-to-GDP ratio even higher today than before the “pandemic,” the trap has grown.
Such is something Dallas Fed President Robert Kaplan warned about: |
 . |
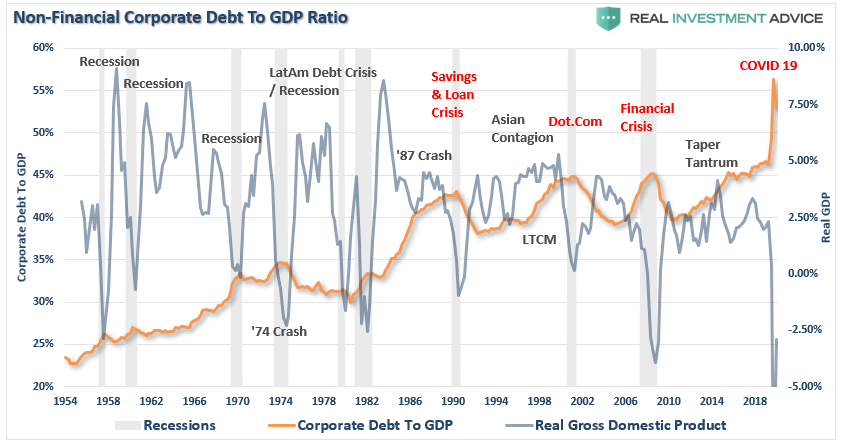 . |
is something Dallas Fed President Robert Kaplan warned about:
U.S. nonfinancial corporate debt consists mostly of bonds and loans. This category of debt, as a percentage of gross domestic product, is now higher than in the prior peak reached at the end of 2008.
A number of studies have concluded this level of credit could ‘potentially amplify the severity of a recession,’
The lowest level of investment-grade debt, BBB bonds, has grown from $800 million to $2.7 trillion by year-end 2018. High-yield debt has grown from $700 million to $1.1 trillion over the same period. This trend has been accompanied by more relaxed bond and loan covenants, he added.
Conclusion
Next year, with a large source of support removed from the market, it could become more challenging for equity investors.
Such is even more likely if the Fed gets its wish for inflation, or bond bears get higher rates. That could be the worse possible outcome for equity markets as the supports of low rates, debt issuance, and “valuation” support all reverse.
Investors are currently following the Chuck Prince investing mantra by “dancing while the music is playing.”
It is worth remembering that eventually, the song ends.
The post A Major Support For Asset Prices Has Reversed appeared first on RIA.
You Might Also Like
 Passive Fingerprints Are All Over This Crazy Market
2020-07-16
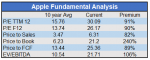
Passive Fingerprints Are All Over This Crazy Market. Apple’s stock is up over 20% since the market peak in February. Without a doubt, Apple, the company, is worse off due to the crisis and global recession. Revenue and earnings will be inferior to what Wall Street had forecast at lower stock prices. Valuations, shown below, are now astronomical.
 Reading The Market’s Postmodern Mind
2020-07-24
No matter how you slice it, markets are human. This even applies to the “algos” as it’s we who write their mechanistic marching orders. Thus, understanding human behavior can be helpful in assessing and anticipating market moves. There’s no choice in the fact that we all need a philosophy to live.
 Technically Speaking: COT Positioning – Back To Extremes: Q2-2020
2020-08-05
As discussed in Is It Insanely Stupid To Chase Stocks, the market has gotten quite ahead of the fundamentals as money continues to chase performance. In the Q2-2020 review of Commitment Of Traders report (COT,) we can see how positioning has moved back to extremes.
 The 4.0 percent Rule Is Dead. What Should Retirees Do Now?
2020-08-24
The 4% Rule Is Dead. A recent article by Shawn Langlois via MarketWatch pointed out this sobering fact but is one we have discussed previously. Retirees have long counted on being able to retire on their assets and take out 4% each year. However, a little more than 20-years later, the “death of the withdrawal rate” has arrived. What should retirees do now?
 Technically Speaking: Why This Isn’t 1920. Valuations & Returns
2020-08-26
Why this isn’t 1920 has everything to starting valuations and future returns. While, generally, I’m not too fond of comparisons between today’s markets and the past, Ed Yardeni made a comparison too bombastic to disregard in his blog.
2020-11-20
Investing is incredibly hard. Mapping observations to security price movements are complex. Often, the relationships governing these moves are unknown. Yet, this is the investor’s task. I’ve used this blog as a tool for exploring some of these connections. It’s been incredibly rewarding.
 The 4 Investing Levels: Control vs Fees
2020-09-04
Investing is very important if you want to fight inflation and get returns on your saved money. But there are many ways to invest. Some of these ways are very simple, while others are complex.But with simplicity comes higher fees. If you want the lowest price possible, you will need to get more control, and thus complexity.
 Free by 40 in Switzerland – Book Review
2020-11-27
I just finished reading Free by 40 in Switzerland, a book about financial independence, in Switzerland, by fellow blogger Mr. Mustachian Post, alias Marc Pittet. Mr. MP was kind enough to send me a version that I could review before the release date. So I can have this review ready now that the book is available!
Tags: Featured,Investing,newsletter