In the big picture, we argue that the dollar’s appreciation is part of the third significant dollar rally since the end of Bretton Woods. The first was the Reagan-Volcker dollar rally, spurred by a policy mix of tight monetary and loose fiscal policies. The rally ended with G7 intervention to knock it down in September 1985. After a ten-year bear market, a second dollar rally took place. It can be linked to the tech bubble and the shift to a strong dollar policy. The carving out of the internet drew capital into the US and induced Americans to keep their savings here. It may or may not have been sufficient to fuel a multi-year dollar advance. Rubin replaced Bentsen at the helm of Treasury and nearly immediately
Topics:
Marc Chandler considers the following as important: 4) FX Trends, Bank of Japan, ECB, Featured, newsletter, USD
This could be interesting, too:
Nachrichten Ticker - www.finanzen.ch writes Die Performance der Kryptowährungen in KW 9: Das hat sich bei Bitcoin, Ether & Co. getan
Nachrichten Ticker - www.finanzen.ch writes Wer verbirgt sich hinter der Ethereum-Technologie?
Martin Hartmann writes Eine Analyse nach den Lehren von Milton Friedman
Marc Chandler writes March 2025 Monthly
In the big picture, we argue that the dollar’s appreciation is part of the third significant dollar rally since the end of Bretton Woods. The first was the Reagan-Volcker dollar rally, spurred by a policy mix of tight monetary and loose fiscal policies. The rally ended with G7 intervention to knock it down in September 1985. After a ten-year bear market, a second dollar rally took place. It can be linked to the tech bubble and the shift to a strong dollar policy.
The carving out of the internet drew capital into the US and induced Americans to keep their savings here. It may or may not have been sufficient to fuel a multi-year dollar advance. Rubin replaced Bentsen at the helm of Treasury and nearly immediately articulated a shift in policy. No longer would the US use the dollar as a trade weapon as previous administrations and officials did. The US would not engineer a weaker dollar to reduce its debt burden. This is the essence of the strong dollar policy. The US first unilaterally disarmed and then succeeded in convincing the G7 and G20 that de-weaponizing the foreign exchange market was the best practice.
However old habits die hard, during the Clinton dollar rally, the euro was born and immediately depreciated. It fell from around $1.19 to below $0.85. They cried, “Quit picking on our euro,” though the market was really accumulating US assets. In October 2000, after Summers replaced Rubin and at the request of Europe, there was coordinated intervention to buy the euro and sell the dollar. The official action and the popping of the tech bubble marked the end of the Clinton dollar rally.
The greenback went into another multi-year bear market. The Obama dollar rally began from extreme levels. In 2008, the euro reached $1.60. Sterling was above $2.00. The Australian dollar was near $1.00, and the Canadian dollar was above parity.
In the face of the Great Financial Crisis, and despite the slowness to recognize the magnitude of the problem, the US acted relatively early and relatively aggressively. This unleashed the key fuel for the Obama dollar rally—divergence. The US economy recovered sooner and stronger than most of the other major centers. Europe was hit not only by the financial shock that emanated from the US and their bank exposures, but it paralyzed the relationship between creditors and debtors in Europe. The European phase of the crisis began in Greece, and despite the geography lessons by various officials, every debtor country became Greece.
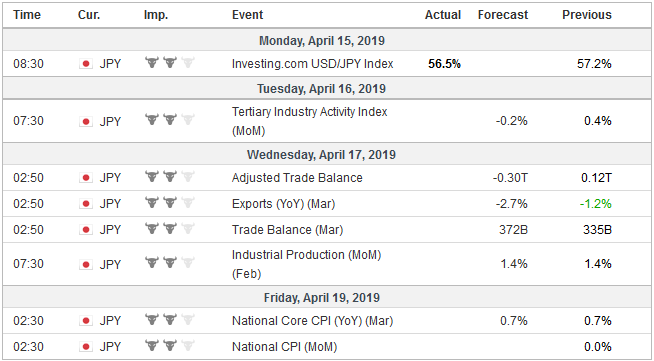
JapanJapan already had very low-interest rates before the Great Financial Crisis. The yen’s role as a financing currency gave it the appearance of a safe haven when its strength largely a function of short-covering. Retail investors mostly focus on the appreciation of the asset they buy. Institutional investors also seek to lower their funding costs and borrowing the low yielding yen to finance equity or bond purchases is a common tactic by leveraged accounts, leave aside the Japanese investors themselves. Japanese officials seemed to dawdle until Abe was elected and Kuroda became the Governor of the Bank of Japan. The second phase of the Obama dollar rally began with the election of Trump in 2016. Both leading candidate in the presidential election promise fiscal expansion. The Federal Reserve had begun the gradual process toward policy normalization. The combination of expanding fiscal policy and tighter monetary policy was a repeat, though on a smaller scale, of the Reagan-Volcker policy mix. With the fiscal stimulus winding down, the dollar may enter the third phase of its super-cycle: a return to divergence. Recall that the global slowdown began in H2 18, but the fiscal stimulus that is saddling the US with more a trillion dollar a year deficit helped mitigate the pressure. It grew at an average pace of 3.8% in the middle two-quarters last year. The German and Japanese contracted in Q3 and Q4 was only a little better. The Italian economy contracted in both quarters. The European Central Bank’s policy response has to been to push out its commitment not to raise interest rates and prepare for a new long-term loan facility (TLTRO III). The Bank of Japan, unlike the ECB, continues to buy a range of assets, including corporate bonds and equities. Abe has appointed a couple of members to the BOJ board that dissent in favor of new measures to reach in the inflation target, but there seems to be little appetite for more asset purchases or deeper negative interest rates. Pressure is building to postpone again the sales tax increase that is to kick-in October 1. The government has already enacted measures that are hoped to offset the economic impact of the tax increase. Abe campaigned for his third term last year backing the tax increase over opposition that wanted to abolish it entirely. |
Economic Events: Japan, Week April 15 |
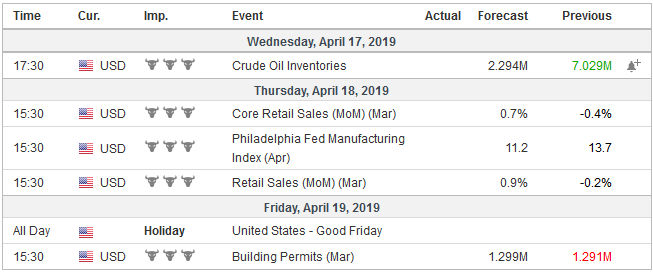
United StatesThe US economy began the year on soft footing. It appeared to have nearly stagnated. The Atlanta Fed’s GDP tracker started the quarter with a sub-0.5% projection. It now stands at 2.3%, a touch above Q4 18’s 2.2% pace. This is a little above what most Fed official see as the long-term non-inflationary pace. The high-frequency data in the coming days should depict an economy that is on the mend. A return to the status quo ante—the pre-stimulus pace of growth. The US average quarterly growth (annualized) in 2017 of 2.5% and 1.9% in 2016. Manufacturing output likely increased for the first time this year. The broader measure of industrial production may have also accelerated. The American consumer likely made up for lost time. Retail sales fell at an annualized rate of about 4.5% the December through February period. March retail sales rose by 0.9%, according to the median forecast in the Bloomberg survey. The components used for GDP calculations are expected to rise by 0.5% after falling 0.2% in February. The Leading Economic Indicator averaged 0.5% in Q3 18 and fell to -0.1% in the fourth quarter. It may have risen by 0.4% in March, which would be the strongest since last September. It lends credence to our hypothesis that the economy did hit a soft patch, but it is resilient and is already emerging. The most important data point from the euro area will be the flash April PMI on April 18. Recall that in March, France’s manufacturing and service PMI were below the 50 boom/bust level. The German manufacturing PMI was below 50. A small to modest improvement is unlikely to change the ECB’s assessment that risks to its outlook remain on the downside. |
Economic Events: United States, Week April 15 |
Three headwinds impacting the US have lifted. The drop in equities has been reversed, and bond prices are higher. The government re-opened, and the weather is less extreme. Europe is not as fortunate. Its headwinds have barely lifted. The uncertainties over Brexit continue. The disruption from Turkey has not been fully absorbed. Policy initiatives seem frozen ahead of European Parliament election at the end of next month.
The US announced $11 bln in tariffs on European goods for subsidies to Airbus that the WTO ruled illegal. This was a shot across the bow and warns of difficult trade talks that lie ahead. The US continues to threaten 25% tariffs on auto imports, which would be a significant blow, especially at a time when European industry is already challenged.
Japan moves into the spotlight next week as the bilateral trade talks with the US formally begin in Washington. Prime Minister Abe is expected to visit the US later this month before Trump visits Tokyo next month and meets the new Emperor. By pulling out of the Trans-Pacific Partnership, Trump has the US playing catch-up. Other agriculture surplus countries like Canada and Australia have better access to the Japanese market now. The US is defending a little more than a 20% market share of Japan’s agriculture imports. Japan cannot give the US better terms than it conceded in TPP negotiations, which ironically the US played an important role.
Japan enjoys around a $65 bln trade merchandise surplus with the US. The US runs a chronic surplus in services with Japan. It is almost $15. The US is fond of citing the merchandise imbalance while forgetting the service surplus. Tariffs on autos and auto parts like the US threatens, would be a shock for an economy that seems to be barely growing.
US-Japan talks could have two parts. The first is to pick the low hanging fruit, like granting the US the same terms as the TPP. This would give Trump a success, while not distracting Japan ahead of the upper house election in July and the G20 meeting its hosts (for the first time) in late June.
Tags: #USD,Bank of Japan,ECB,Featured,newsletter


