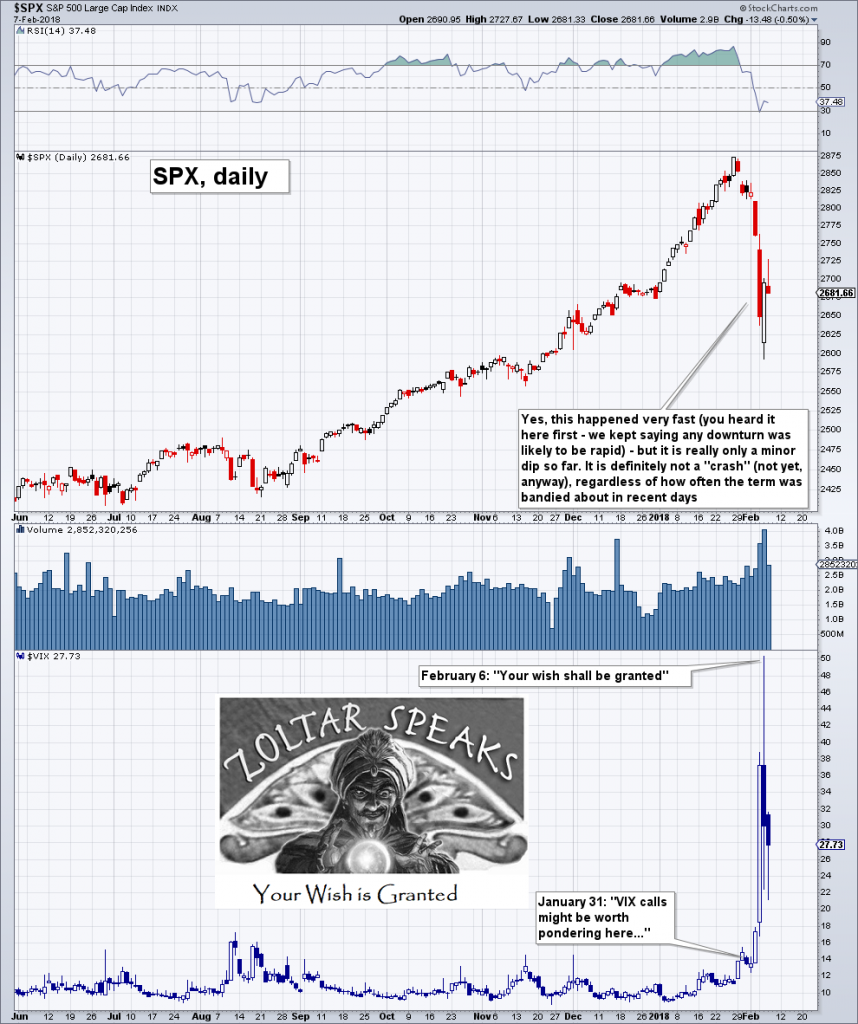
It’s Just a Flesh Wound – But a Sad Day for Vol Sellers On January 31 we wrote about the unprecedented levels – for a stock market index that is – the weekly and monthly RSI of the DJIA had reached (see: “Too Much Bubble Love, Likely to Bring Regret” for the astonishing details – provided you still have some capacity for stock market-related astonishment). We will take the opportunity to toot our horn by reminding readers that we highlighted VIX calls of all things as a worthwhile tail risk play. Not only were we right, we were actually kind of double-plus right, with near perfect timing to boot. That doesn’t happen very often, so forgive us for enjoying this brief moment of Zoltar glory. Sometimes it just works…
Topics:
Pater Tenebrarum considers the following as important: Chart Update, Debt and the Fallacies of Paper Money, Featured, newsletter, S&P 500 Large Cap Index, S&P 500 Large Cap Index, The Stock Market
This could be interesting, too:
Nachrichten Ticker - www.finanzen.ch writes Die Performance der Kryptowährungen in KW 9: Das hat sich bei Bitcoin, Ether & Co. getan
Nachrichten Ticker - www.finanzen.ch writes Wer verbirgt sich hinter der Ethereum-Technologie?
Martin Hartmann writes Eine Analyse nach den Lehren von Milton Friedman
Marc Chandler writes March 2025 Monthly
It’s Just a Flesh Wound – But a Sad Day for Vol SellersOn January 31 we wrote about the unprecedented levels – for a stock market index that is – the weekly and monthly RSI of the DJIA had reached (see: “Too Much Bubble Love, Likely to Bring Regret” for the astonishing details – provided you still have some capacity for stock market-related astonishment). We will take the opportunity to toot our horn by reminding readers that we highlighted VIX calls of all things as a worthwhile tail risk play. Not only were we right, we were actually kind of double-plus right, with near perfect timing to boot. That doesn’t happen very often, so forgive us for enjoying this brief moment of Zoltar glory. Sometimes it just works… Zoltar has happy news for that exceedingly rare species, the “long vol” speculator (lately seen to be recovering – the endangered species, we mean). |
S&P 500 Large Cap Index, Jun 2017 - Feb 2018(see more posts on S&P 500 Large Cap Index, ) |
| Most of our readers are probably aware by now that there was a very specific reason behind the VIX intraday spike to more than 50 points in the face of what was not even a 10% correction. One of the most beloved “free money”/ “it’s like taking candy from a baby” trades of the past few years, namely “selling volatility”, blew up rather spectacularly for some traders.
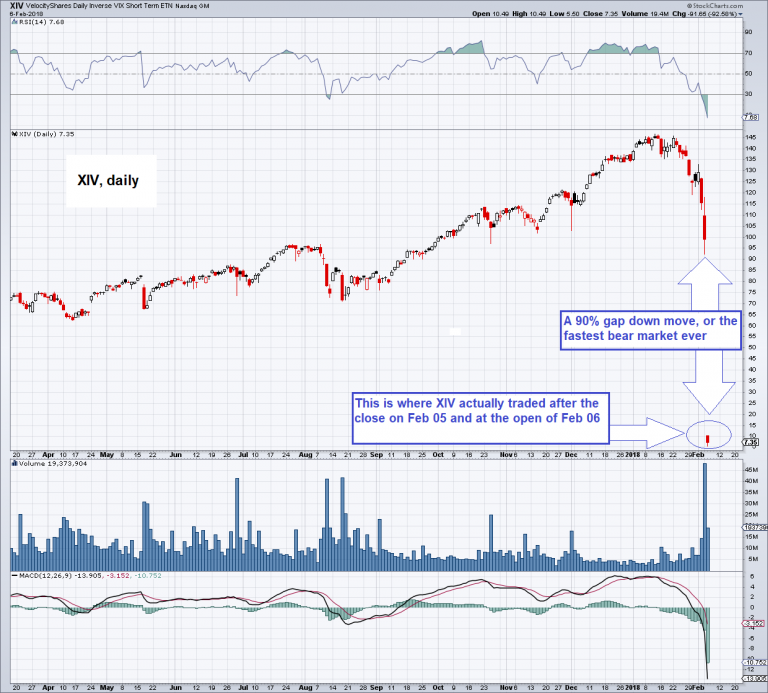
Judging from assorted sob stories that have made the rounds, some people appear to have neglected reading the fine print accompanying leveraged inverse VIX ETNs (or decided to ignore it). These instruments benefit greatly from a declining VIX, but are rather uncomfortable to hold during VIX spikes. ETNs such as the recently unceremoniously expired XIV are liquidated if they lose more than 80% of their value in a single day. What many people failed to consider was the fact that the VIX is subject to an effect akin to bond convexity – which was incidentally a major reason why we liked VIX calls as a tail risk play. Essentially, the lower the VIX went in absolute terms, the more likely it became that it would one day experience a very large percentage move in a very short time period (such as going up by 100% or more in one day). Given that there wasn’t even a single noteworthy down day since early 2016 and considering that the market had become extremely overbought, people should have expected that a bit of upheaval would eventually intrude and at least interrupt the party. Ultimately it didn’t take much to bring XIV and at least one more inverse VIX ETN to their knees. XIV – the inverse VIX ETN performed gloriously as long as the VIX declined – but this decline by itself actually laid the foundation for the subsequent one day wipe-out of the ETN. Ironically, some $500 million or so had poured into the fund just one week earlier, with traders piling in at the first sign of market weakness. |
XIV Daily, Apr 2017 - Feb 2018 |
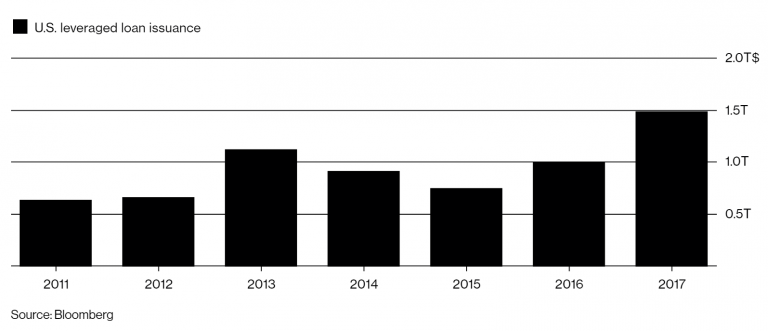
From Hysteria to “Party On Dudes!” in Two DaysWhat we find rather remarkable about the past week was the response to these events. At first there were signs of hysteria – for instance Federal Funds futures traders took an entire rate hike out of their market-based interest rate expectations for this year, while Mario Draghi let it be known that the “ECB was in touch with market participants” in order to gauge the risks allegedly posed by a less than 10% stock market correction. Many financial media reported on the 4%+ slide on Monday in a tone one would normally expect to be reserved for reports on a major asteroid strike or a nuclear attack. It is also astonishing how many victims this fairly small dip has already claimed, from the holders of XIV to the “Probabilities Fund”, which was supposed to “take some of the risk out of stock market investing” and fell by more than 8% on Monday alone. We should add that the fund has performed excellently hitherto, but we don’t think this was due to efforts to make stock market investing less risky, but rather a function of the fact that it rode the biggest bubble ever with a leveraged long position (hence the more than 8% knee-capping on Monday). Consider also that XIV represented assets of just $8 billion – certainly a nice chunk of money for such an esoteric trading vehicle, but essentially nothing compared to many other obscure investment instruments, which have just as great a likelihood of blowing up one day (although probably not as rapidly). For instance, Bloomberg reminds us that ETFs holding leveraged loans have proliferated, as have CLOs. These instruments represent ticking time bombs at least an order of magnitude larger than XIV and its cohorts. |
US Leveraged Loan Issuance, 2011 - 2017 |
| US leveraged loan issuance has gone bananas last year (the same happened in Europe) – at least 80% of these are “cov lite” loans nowadays, which offer practically no protection to creditors in the event of default. These loans can be sold, but are obviously not the most liquid instruments out there – that has not kept enterprising investment banksters from stuffing them into ETFs, most of which are presumably held by potentially skittish retail investors. If these ETFs are hit by a flood of redemption requests, all hell is likely to break loose in numerous nooks and crannies of the financial system’s plumbing.
After the tanking by roughly 1,175 points on Monday, the widely followed DJIA recovered by more than 500 points on Tuesday. This is quite a bit of volatility, but mainly by recent standards. A plethora of gloomy forecasts issued on Monday was immediately replaced by headlines such as “BlackRock sees opportunity to take on more market risk”. They didn’t mention that this opportunity exists every day. This rush to get back in is almost unseemly. In the meantime, we have been inundated with what appears increasingly like a major outbreak of wishful thinking. The most striking assertion was that “the fundamentals are sound”. Even if they were (the point is definitely debatable), the question should be whether they are already priced in. Stocks are not just priced for “sound fundamentals” in our opinion – they are priced for Nirvana. And as we will show in Part 2, the most important fundamental datum should actually elicit quite a bit of concern at this stage. |
CAPE Shiller P/E Ratio, 1890 - 2018 |
| There are times when taking on more market risk is bound to pay off. Right now it seems that avoiding risk may be the more prudent approach. Will be be able to surpass Nirvana? If not, why should valuations expand even more?
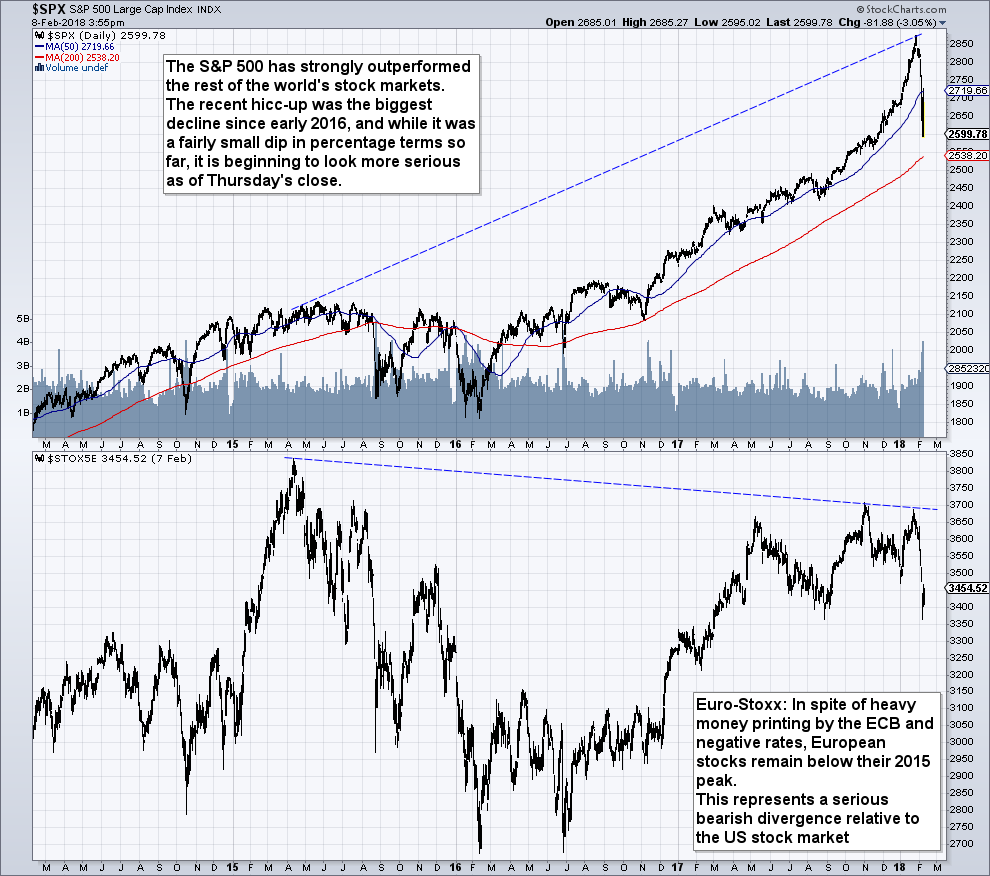
We want to conclude this article with a technical observation. Below we compare the S&P 500 Index to the Euro-Stoxx 600 Index. We continue to believe that this massive divergence could be meaningful. This is very different from how these markets have behaved in the past. Note that it never mattered that Europe is considered more socialistic than the US, as the large multinational companies dominating the benchmark indexes are not bound by the limits imposed by geography. What makes this chart particularly interesting is that the ECB is still printing gobs of money outright, even though it has slowed the pace of QE considerably. And yet, the performance of European stocks left a lot to be desired compared to that of US stocks over the past two years. It may be a sign that the papering over of the euro crisis will eventually fail, but right now the most important thing is that it constitutes a major bearish divergence. |
S&P 500 Large Cap Index, March 2014 - Feb 2018(see more posts on S&P 500 Large Cap Index, ) |
Soon you will learn a few new acronyms, as we will discuss data that are not often mentioned, or are considered rather obscure. The thing is, even “obscure” and “arcane” segments within the financial markets and the economy have attracted enormous amounts of investment. We suspect quite a bit of this capital will turn out to have been malinvested.
Addendum:
As we write these words, the DJIA has once again suffered a more than 1,000 point decline. Perhaps we are indeed in a situation akin to the ChiNext collapse of 2015 we looked at last week.
Tags: Chart Update,Featured,newsletter,S&P 500 Large Cap Index,The Stock Market


