A Month with a Bad Reputation A certain degree of nervousness tends to suffuse global financial markets when the month of October approaches. The memories of sharp slumps that happened in this month in the past – often wiping out the profits of an entire year in a single day – are apt to induce fear. However, if one disregards outliers such as 1987 or 2008, October generally delivers an acceptable performance. Nevertheless, the prospect of such an extremely strong decline is scary: what use is it to anyone if markets typically perform well in October most of the time, when the phenomenon of the gains of an entire year evaporating in the blink of an eye is repeated? What about intermittent losses? We will apply
Topics:
Dimitri Speck considers the following as important: 6) Gold and Austrian Economics, 6b) Austrian Economics, 7) Markets, commodities, Credit Markets, Featured, newsletter, The Stock Market
This could be interesting, too:
Nachrichten Ticker - www.finanzen.ch writes Die Performance der Kryptowährungen in KW 9: Das hat sich bei Bitcoin, Ether & Co. getan
Nachrichten Ticker - www.finanzen.ch writes Wer verbirgt sich hinter der Ethereum-Technologie?
Martin Hartmann writes Eine Analyse nach den Lehren von Milton Friedman
Marc Chandler writes March 2025 Monthly
A Month with a Bad ReputationA certain degree of nervousness tends to suffuse global financial markets when the month of October approaches. The memories of sharp slumps that happened in this month in the past – often wiping out the profits of an entire year in a single day – are apt to induce fear. However, if one disregards outliers such as 1987 or 2008, October generally delivers an acceptable performance. Nevertheless, the prospect of such an extremely strong decline is scary: what use is it to anyone if markets typically perform well in October most of the time, when the phenomenon of the gains of an entire year evaporating in the blink of an eye is repeated? What about intermittent losses? We will apply seasonal analysis to the issue in order to shed light on whether one should adopt a risk-averse stance in October. |
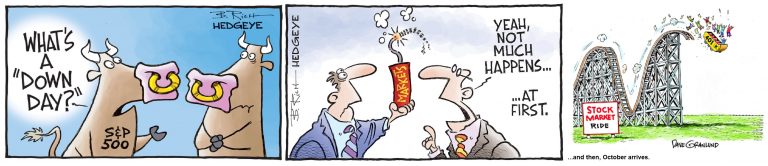 The road to October… not much happens at first – until it does. [PT] - Click to enlarge |
The Biggest Crashes Tend to Happen in OctoberLet us take a look at the largest declines in recent history. The following chart shows the twenty largest one-day declines in the Dow Jones Industrial Average. Crashes that occurred in October are highlighted in red. The largest one-day declines in the DJIA in history – almost half of the crash waves occurred in October, including the two largest ever recorded on 19 Oct. 1987 and 28 Oct. 1929. The fourth largest decline happened on 29 Oct. 1929 hence these two days of consecutive declines were actually worse than the record one-day plunge in 1987 (similar to 1987, the market had already fallen sharply in the week immediately preceding the crash). 9 of the 20 strongest one-day declines happened in October. That is an extremely disproportionate frequency. In other words, October has a strong tendency to deliver negative surprises to stock market investors in the form of sudden crashes. What does this mean for us as investors? |
The largest one-day declines in the DJIA in history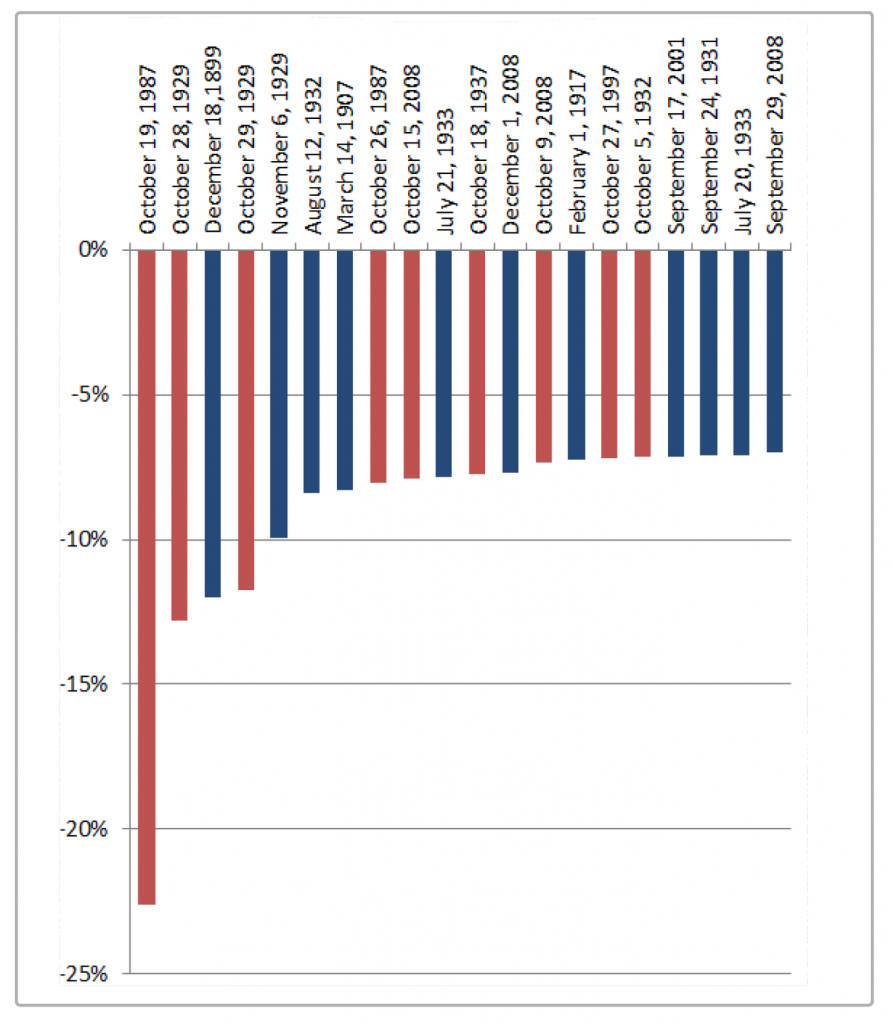 - Click to enlarge |
What to Make of Exceptionally Large Gains?
First of all, the first half of the year appears to be much safer from sudden declines. Only two of the 20 largest one-day losses happened in these six months.
But what is the takeaway for us? We must not allow to let ourselves be deceived. Even though such extreme price declines are rare, they do exhibit seasonal tendencies as well. Although it is more likely in most years that gains rather than losses are generated, the losses frequently turn out to be exceptionally large.
October Isn’t All That BadDespite the fact that large price declines frequently happen in October, it is at the same time not a weak month on average. We have used the Seasonax App to carry out a seasonal analysis for the Dow Jones Industrial Average. The results are depicted in the seasonal chart below. Contrary to standard price charts, seasonal charts do not show actual prices over a specific time period. They rather show an average of prices over a large number of years in relation to the time of the year. The chart on the following page illustrates the average annual price pattern of the DJIA calculated over a span of 29 years. The chart illustrates the typical seasonal price pattern of the DJIA. As can be seen, statistically the weakest month is actually September rather than October (see also: “September – the Most Dangerous Month to Invest”). In the course of October the market tends to move sideways on average. Net-net it even exhibits a small gain, albeit a well below average one. Nevertheless, October delivers a better average performance than its reputation among stock market participants would suggest. Of course this reputation is not entirely undeserved, given that it stems from the fact that particularly large short term declines actually do frequently occur in October. |
DJIA 29 year seasonal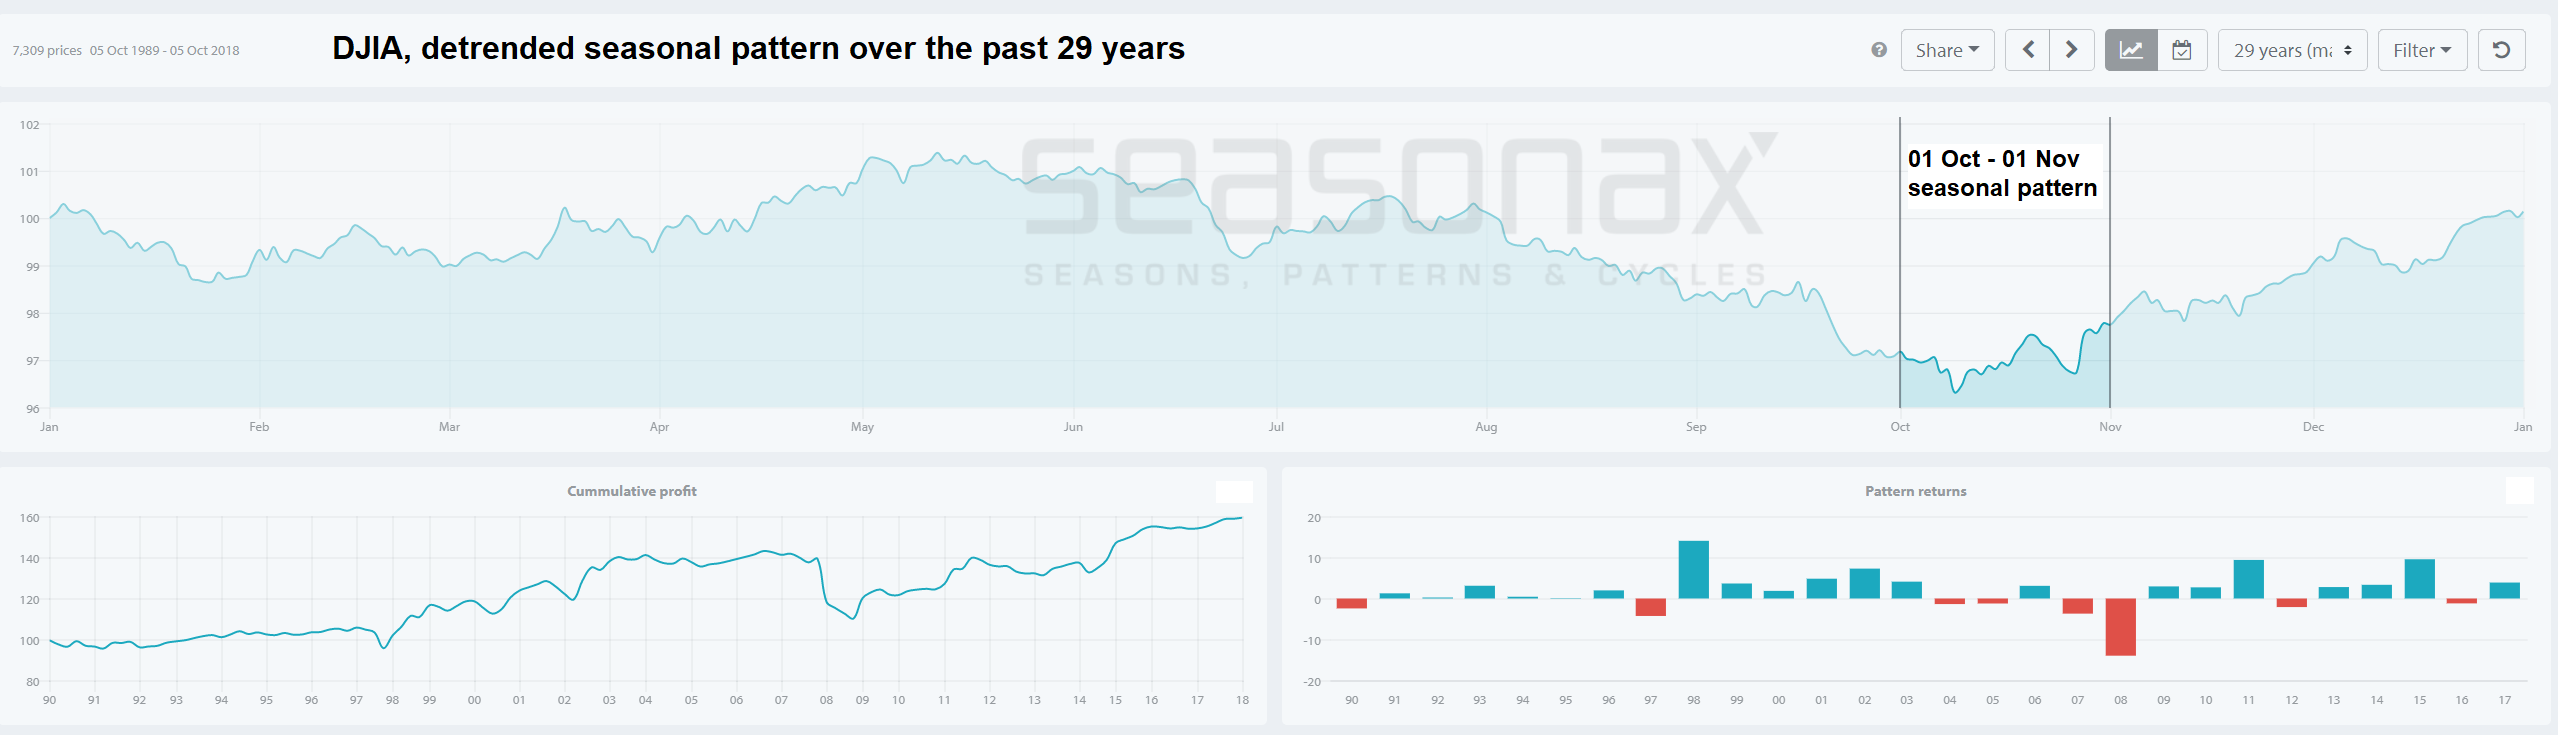 - Click to enlarge DJIA – a detrended seasonal chart over the past 29 years. Overall, the market tends to move sideways in the month of October, with a slight upward bias. In fact, more gains than losses were posted in the past 29 years, and if one had held a long position in every year, one would have come out ahead with a (below-average) cumulative profit despite the 2008 massacre. Note however that this is predicated on the average weakness of the month of September, which is typically the weakest month of the year. Although this is not part of this study, we would suggest that it is probably fair to assume that in years in which September was relatively strong it will be more difficult to achieve additional gains in October. [PT] |
Try out our Web Application to Perform Seasonal Analysis
This seasonal analysis was carried out with the aid of our web application, which was launched several months ago. One no longer has to have access to Thomson Reuters Eikon or a Bloomberg terminal, instead this version can simply be accessed via a normal web browser.
In short, we have made this powerful tool for analysis available to anyone with a functioning internet connection! Simply access the Web App of Seasonax here and give our free patterns a try. It will help you optimize your portfolio with a view toward avoiding or reducing exposure to extreme seasonal risks.
Addendum by PT: Mid-Term Election Seasonal PatternThe chart below shows the seasonal chart of the SPX in mid-term election years over the past three decades. As you can see, the market typically declines into October 9, after which a powerful seasonal rally begins. |
SPX 90 years seasonal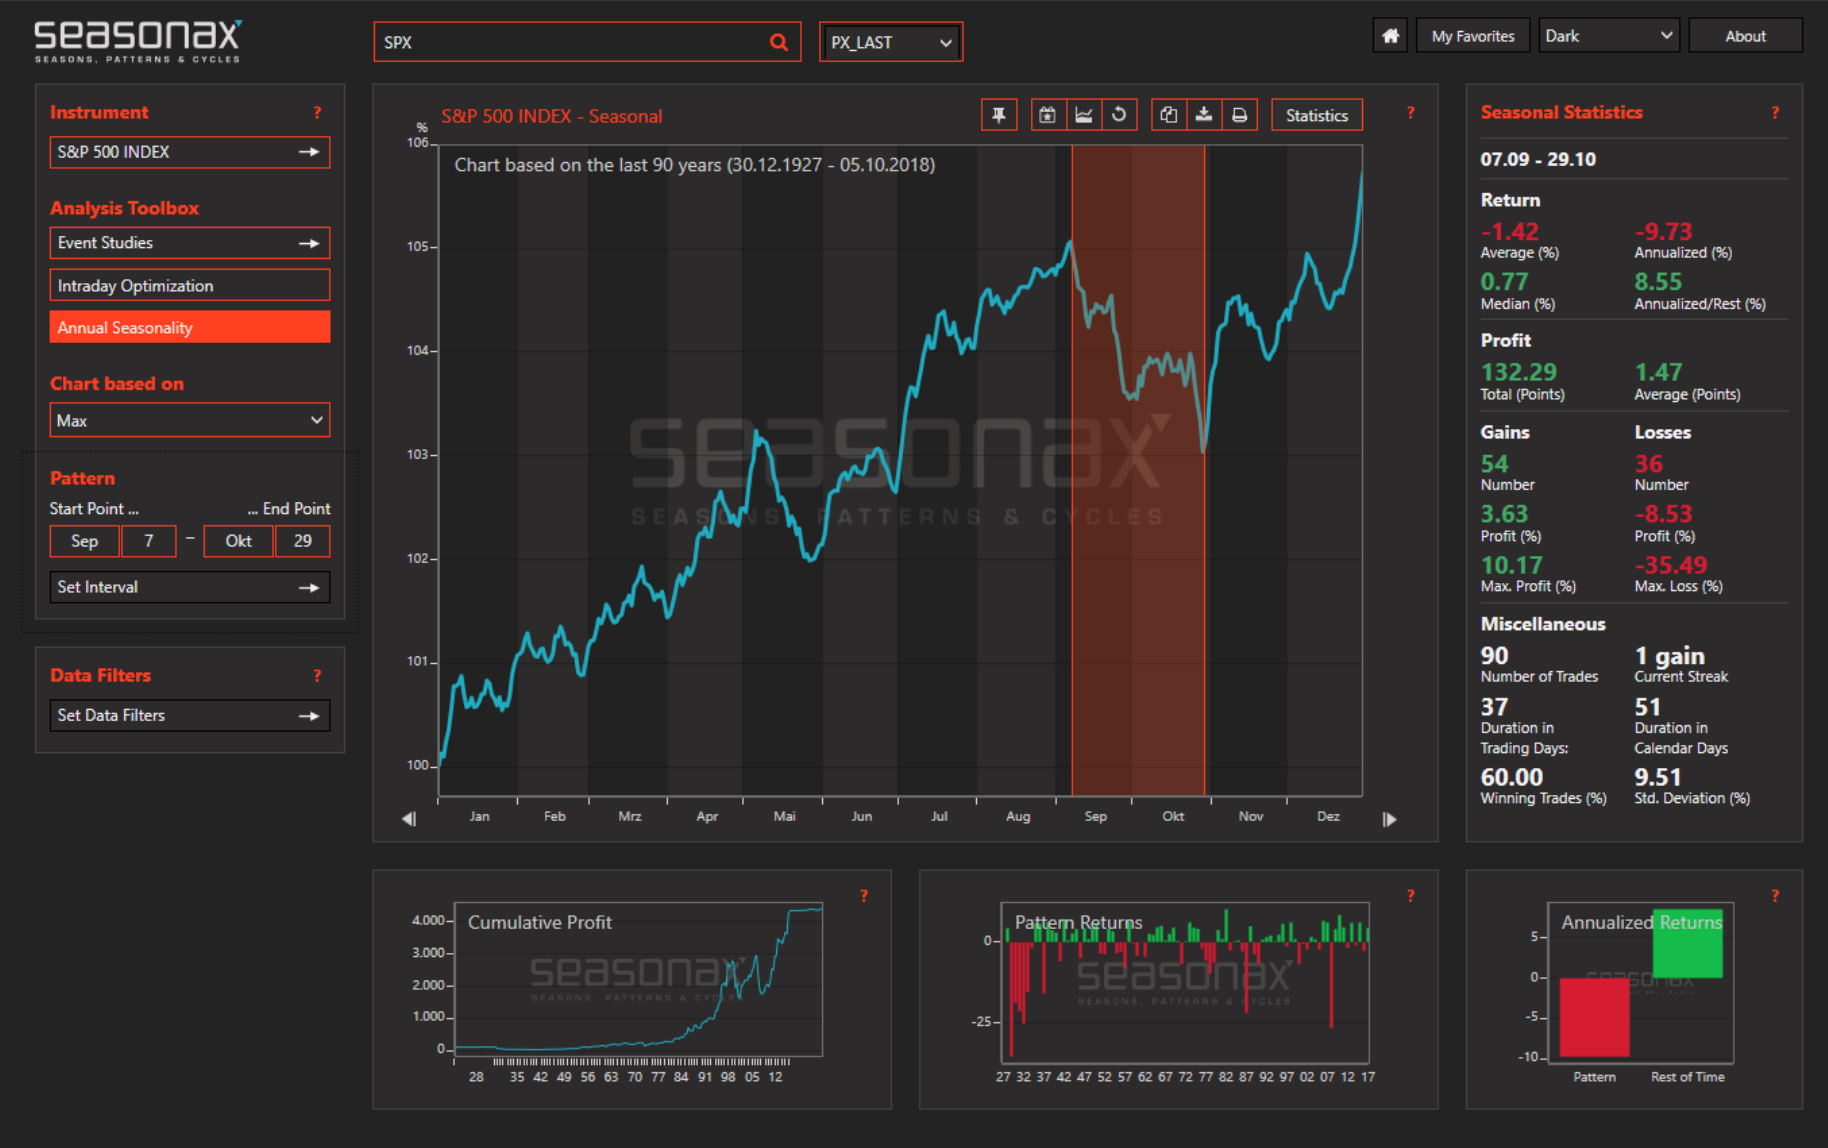 In the 7 mid-term election years since 1990, the SPX delivered a powerful end-of-the-year rally 6 times. In the only losing year 1994 it posted a mere 0.02% loss. - Click to enlarge |
| The seasonal chart of mid-term elections since 1990 suggests a high likelihood of a strong rally. However, something is different this year: the pattern of the stock market looks markedly different from the average mid-term pattern. Compare this year’s SPX chart to the seasonal chart:
Not only does the 2018 pattern so far look like the exact opposite of the typical mid-term election year pattern, but the markets are also faced with a large reduction in central bank liquidity injections from October onward (“QT” by the Fed increases to USD 50 billion per month, while the ECB is cutting QE in half from EUR 30 to EUR 15 billion per month). This suggests that there is a strong possibility that the pattern will continue to run opposite to the usual seasonal trend this year. |
S&P 500 Large Cap Index 2018(see more posts on S&P 500 Large Cap Index, )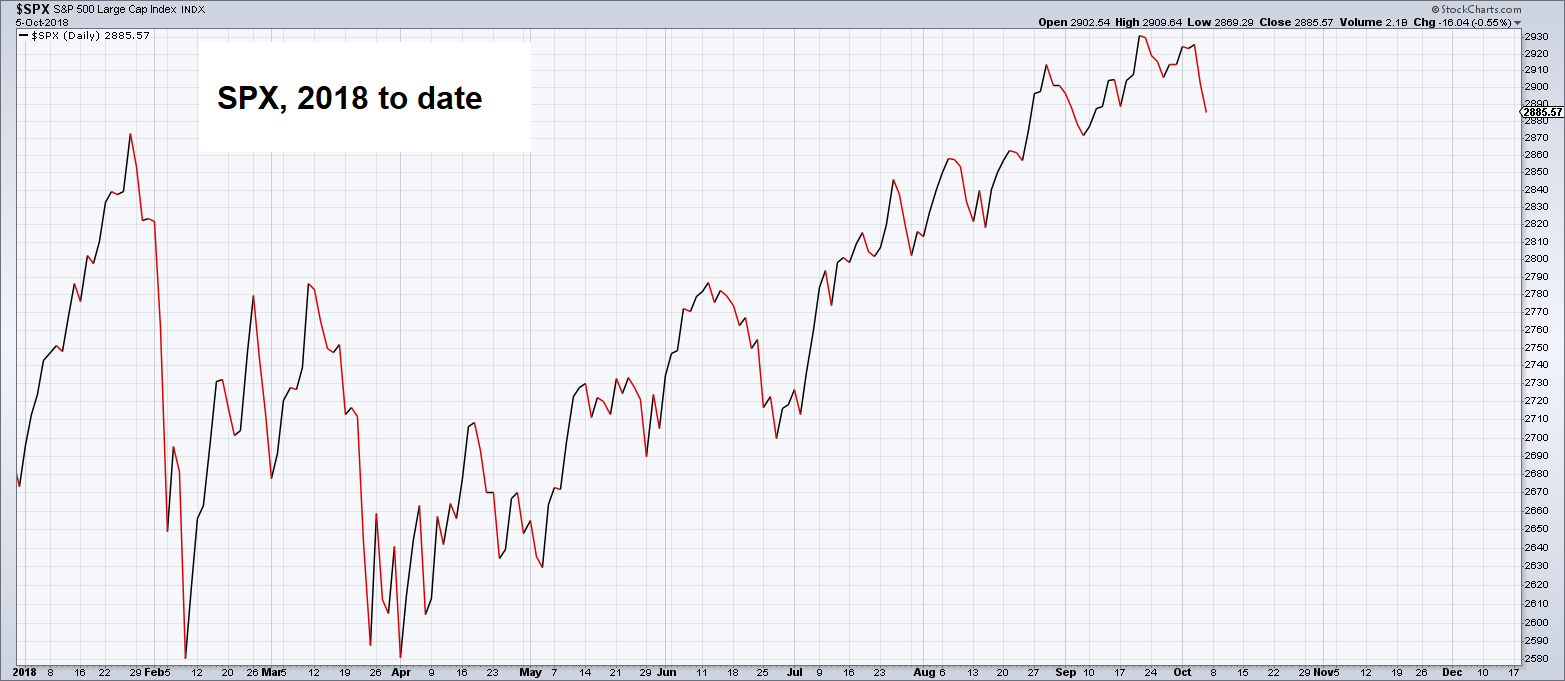 The SPX pattern in 2018 to date looks almost like a mirror image of the “normal” seasonal pattern in mid-term election years. Somehow it seems unlikely that it will deliver the typical seasonal strength at year-end, which normally tends to begin from “oversold” levels. - Click to enlarge |
Chart sources: “Sizzlers and Fizzlers” Seasonax Web App, Seasonax Bloomberg App, StockCharts
Chart & image captions, editing & addendum by PT
Tags: commodities,Credit Markets,Featured,newsletter,The Stock Market