Gold hedges massive ongoing devaluation of U.S. Dollar 46th anniversary of ‘Tricky Dicky’ ending Gold Standard (see video) Savings destroyed by currency creation and now negative interest rates Long-term inflation figures show gold a hedge against rising cost of fuel, food and cost of living food and beverages basket of 1971 cost 0.17 in 2017 Household items increased by average of 2000% and oil by 5,373% since 1913 Gold gained 5,669% since 1913; by nearly 3,000% since 1971 Dollar has been reserve currency of world in the period and most other currencies have seen greater devaluation Evidence of gold’s role as inflation and currency devaluation hedge US Dollar in Gold, 1950 - 2017(see more posts on Gold,
Topics:
Jan Skoyles considers the following as important: consumer price index, Daily Market Update, Featured, GoldCore, manipulating silver, newsletter, silver, silver mining
This could be interesting, too:
Nachrichten Ticker - www.finanzen.ch writes Die Performance der Kryptowährungen in KW 9: Das hat sich bei Bitcoin, Ether & Co. getan
Nachrichten Ticker - www.finanzen.ch writes Wer verbirgt sich hinter der Ethereum-Technologie?
Martin Hartmann writes Eine Analyse nach den Lehren von Milton Friedman
Marc Chandler writes March 2025 Monthly
|
US Dollar in Gold, 1950 - 2017(see more posts on Gold, U.S. Dollar Index, ) ‘US dollar Purchasing Power As measured By Gold’ Source: Goldchartsrus - Click to enlarge |
You don’t need ‘Tricky Trump’ to devalue the dollar, it’s been doing that since 1913 and ‘Tricky Dicky’ in 1971In 2015 President Donald Trump made headlines when he told a town hall event in Atkinson, New Hampshire about how his father had once given him a ‘small loan of a million dollars.’ Outcry swept around the media who asked how much the future President was really in touch with the common voter. Whilst Trump’s reference to ‘small’ was in relation to the (apparent) size of the empire he subsequently built he may as well have been referring to the value of a million dollars now and how small it is compared to in 1975 when he was lent the money. $1 million dollars was a lot of currency in 1975. Today it will barely buy you a nice house in a nice city. Using today’s CPI data Trump Sr’s $1 million loan would today be equivalent to $4.4 million. The purchasing power of a 1975 US dollar has fallen by over 400%. It has fallen a lot more since 1971. In this week 46 years ago on August 15 1971, President Nixon announced the U.S. Dollar would completely cut ties with sound money gold (see video below). Without gold backing and gold as a monetary anchor, we can now see just how much the purchasing power of the consumer dollar has declined since 1971. You can see an even better example of the dollar’s collapse in purchasing power when measured in gold ounces (see charts above). |
Consumer Price Index for All Urban Consumers, 1977 - 2017(see more posts on Consumer Price Index, )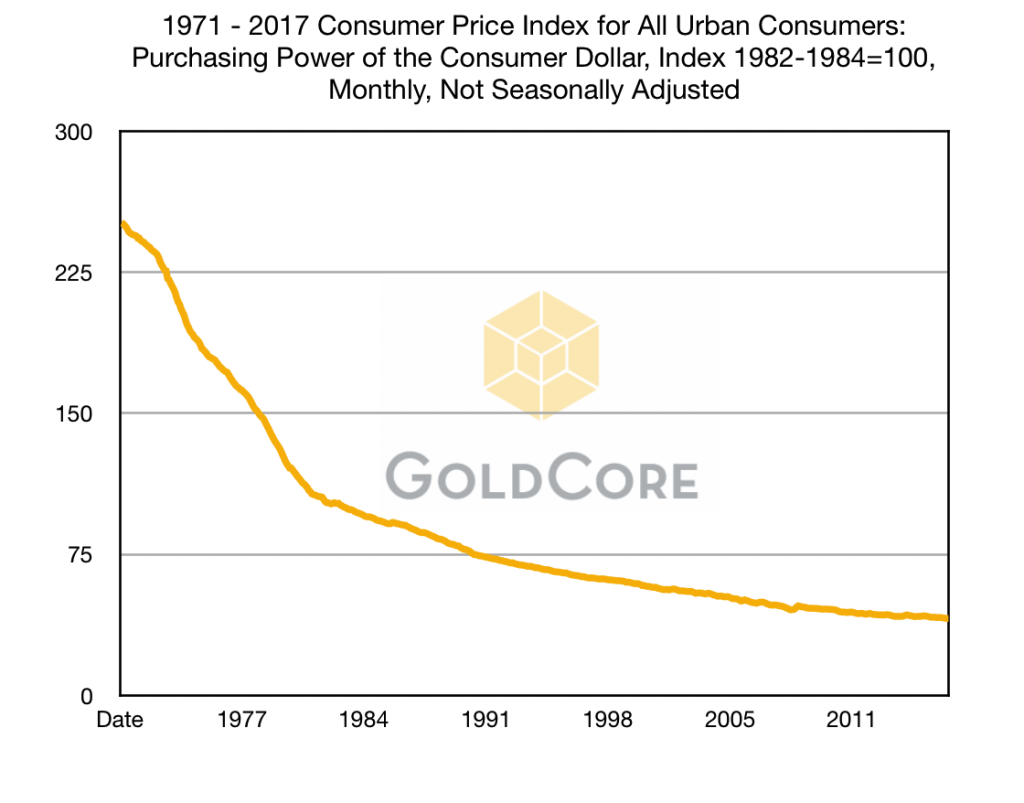 - Click to enlarge |
Prices climb by over 2000% since 1913 and creation of the Fed‘[Since 1913] the general public and policymakers have focused almost constantly on inflation; they have feared it, bemoaned it, sought it, and even tried to whip it.’ Bureau of Labour Statistics. In 1970, after many decades of dollar devaluation, Herbert W. Armstrong quoted the Labor Department’s figures for how much $5 would have purchased in 1913: “15 pounds of potatoes, 10 pounds of flour, 5 pounds of sugar, 5 pounds of chuck roast, 3 pounds of round steak, 3 pounds of rice, 2 pounds each of cheese and bacon, and a pound each of butter and coffee; that money would also get you two loaves of bread, 4 quarts of milk and a dozen eggs. This would leave you with 2 cents for candy.” What changed in 1913? The US adopted the Federal Reserve Banking System and the journey towards dismantling the gold standard and currency debasement began. In the same year the United States government started tracking prices. This was thanks to President William Howard Taft who signed a bill promoting the Department of Labor to a Cabinet-level Department. Following this move the Consumer Price Index (CPI) was created in 1921 and backdated to 1913. Many things have changed since 1913, the most obvious is that the US Dollar is no longer backed by gold and that inflation has been slowly destroying wealth. Despite government efforts to track prices, little has been done about the impact of inflation and our loss of purchasing power. This is best illustrated not just with gold but through day-to-day items that we can all relate to. Below it is clear to see that since before the beginning of the World War I prices of everyday items have climbed by over 2,000%, on average. We can also appreciate how much the U.S. Dollar has depreciated in value when we consider that a $100 bill at the end of the First World War has the equivalent purchasing power of $1,196, today. This is in significant contrast to the price and purchasing power of store of value gold. We often talk about the role of gold during times of war and upheaval. This seems particularly relevant today as Trump and North Korea engage in saber-rattling. The table above shows just how important gold was during war time for the millions of people who were uprooted in the run up to and in 1914 and found themselves refugees, without a country to call home and in need of a borderless currency which would serve them wherever they found themselves. The children or grandchildren of those who escaped with gold would own as asset which has protected and grown their wealth and is today worth over 5,000% more than it was in 1913. |
US Prices 1913 - 2017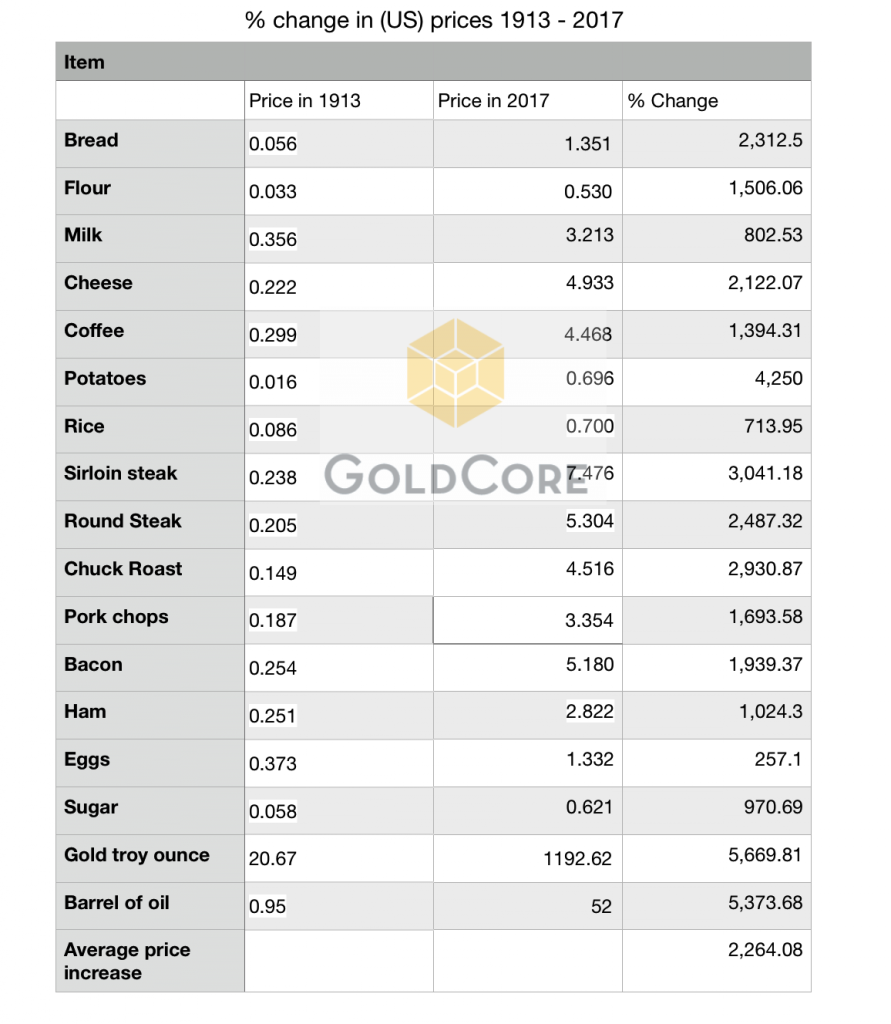 Change in US prices (1913 – 2017) - Click to enlarge |
CPI measure, questionable but availableWhen we complain that food and other household items are becoming more expensive what we are usually experiencing is the devaluation in the US dollar and impact on inflation. To give you an idea of how much the dollar has fallen in value since the removal of the gold standard in 1971, the purchasing power of $100 then would be equivalent to $616.65 today. By comparison, $100 worth of gold in 1971 is now worth nearly $3,700. Today the CPI is the fiat-centric world’s way of tracking consumer prices and, therefore, inflation. We rarely hear about the depreciation of our currencies, instead we are bamboozled with odd figures which rarely translate into our every day life. Despite this, we are still able to use CPI as real evidence of the rising cost of living over time. This is particularly interesting when you look at the change in food prices using 1971 as a base year. We use 1971 as since then the US currency has not been tied to or associated with gold. In the period since then we have seen a slow but damaging impact on the value of people’s wealth and the purchasing power of their earnings. As with our piece on British food prices, British inflation and rising cost of living, we would have preferred to have used actual price information in order to look at the depreciation of the U.S. Dollar. Unfortunately individual price information isn’t readily available for the periods of most interest. Below you can see how much the CPI numbers have increased for items which are considered key in an household’s food basket. When you consider 1971 = 100 as the base year and price, you can see the dramatic changes in prices. The CPI can be misleading and confusing. When looking at the CPI data for the last 46 years it was interesting to note that halfway through the years the BLS decided to change the base year, thus making it appear as though inflation had not increased at quite the rate it had been. The numbers above have been adjusted to the best of our ability. One thing we also noticed when gathering the data was the climb in price of unprocessed foods, look at potatoes, carrots and apples as an example of freshly grown produce. As we looked deeper into data between 1971 and 2017 the list of foods included in the CPI basket grew, thanks to the advent of processed and unhealthy food all of which appear to be more affordable and suffering less from price climbs. As our currency has been debased so has our food. |
CPI Change Food Items, 1971 - 2017(see more posts on Consumer Price Index, )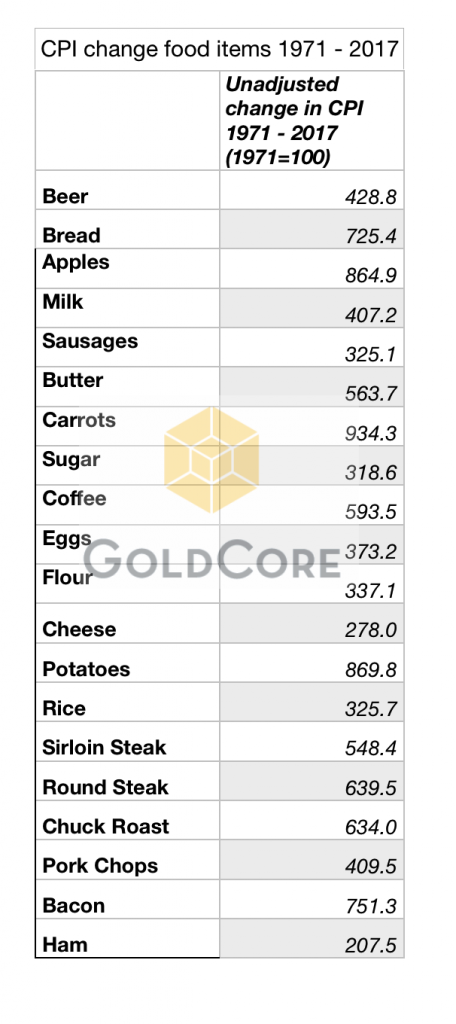 - Click to enlarge |
| For those who are interested in actual prices, rather than the CPI data, we were only able to gather certain figures from the earliest point of 1980. Here you can see that on average the price of food has risen sharply.
This is quite a powerful indication of how gold has acted as a hedge against inflation. Even for those who bought gold, nine years into the bull market and near the top in 1980, gold protected their purchasing power. |
US Prices 1980 - 2017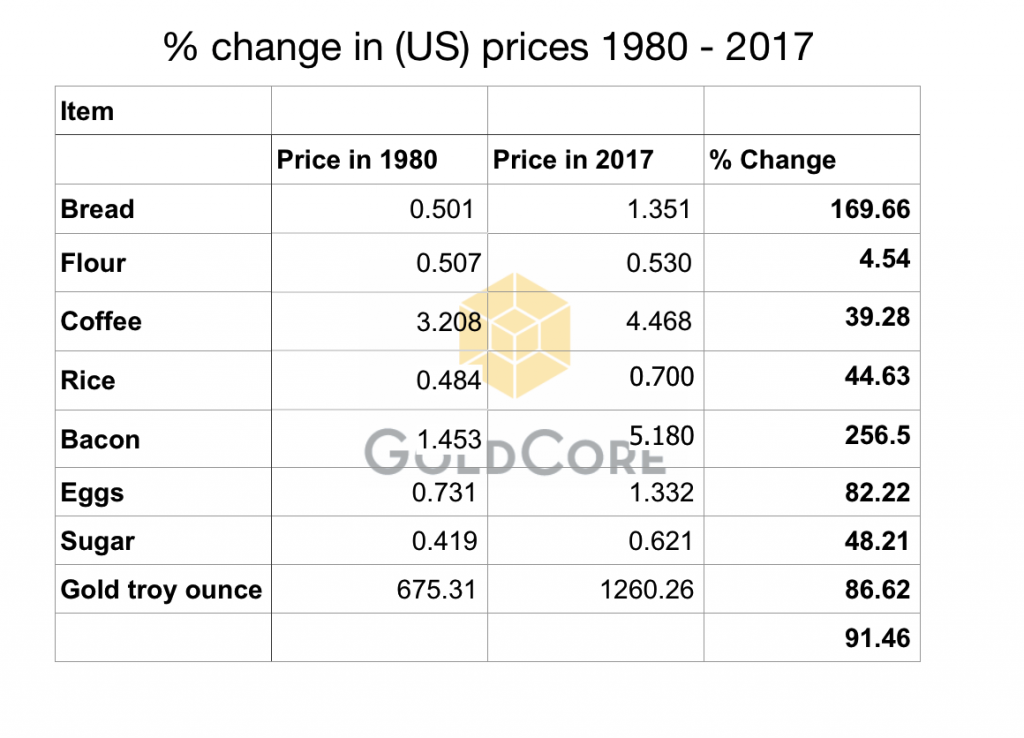 % change in (US) prices 1980 – 2017 - Click to enlarge |
Not just about foodAs we mentioned when we looked at the depreciation of the British pound, the price of food is not the only thing to hurt the average consumer. Fuel is the backbone of any economy, it affects the price of living both directly and indirectly. It affects the price of your food through to the cost of the journey from the farm to the fork. The price of oil, fuel and energy related items have increased massively since 1971. The graph above, courtesy of the St Louis FRED database, shows just how much the price of fuel items have increased since 1971. |
Consumer Price Index for All Urban Consumers, 1971 - 2017(see more posts on Consumer Price Index, )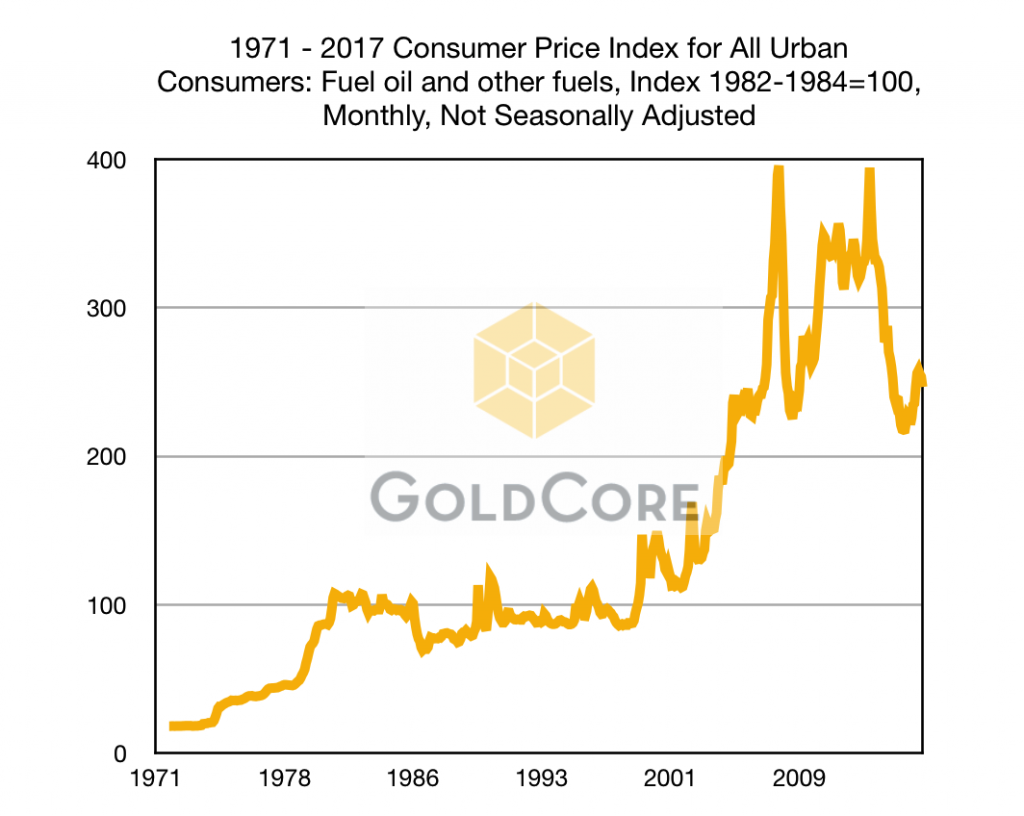 - Click to enlarge |
The depreciation of the dollar, just a myth?A couple of years ago Business Insider ‘Stalwart’ Joe Weisenthal, now Bloomberg presenter and host wrote about how the depreciation of the US Dollar was a ‘myth’. He based this on the logic that hardly anyone keeps their cash in a box or ‘under the mattress’ anymore, but (he conceded): ‘Yes, if someone had a bunch of cash in 1959 and literally put it in a shoebox, they’d have lost a lot of money over the last several decades” But what happens when you don’t keep your money to yourself? You have to put it in a bank account or invest it in stocks, bonds, IRAs etc. All of those things come with counterparty risk. For some of us, it makes sense to hold a percentage of our wealth outside of the banking and financial system. However we cannot do this with paper bank notes as, as Mr Weisenthal reminds us, it just loses its value over time. This is why we recommend clients hold some of their savings in gold and silver. You are not keeping it in the banking system, you do not need to ‘fear’ the impact of inflation and you certainly do not need to worry about counterparties either devaluing it or trying to confiscate it – if owned in safer jurisdictions such as Singapore and Switzerland. Gold has acted as hedge against inflation and a financial insurance against the tyranny of central bank policies, throughout history but no more so than in the last century. No matter banking system, measure of inflation or government your country has, one ounce of gold remains one ounce of gold. It is the same and is recognised everywhere which confers vitally important liquidity. It is clear to see from the charts above that the fiat currency system works against the long-term desire to protect and grow our wealth. This is thanks to both the fractional reserve banking system but also thanks to the confiscatory practices of governments and powerful the financial industry and the currency debasement of central banks. As former Federal Reserve Chairman Alan Greenspan said himself |
“In the absence of the gold standard, there is no way to protect savings from confiscation through inflation. There is no safe store of value.” |
| We are no longer on a gold standard, nor are we likely to be on one for the foreseeable future. But this does not mean savers cannot implement their own version in their portfolios.
We all need to eat and we all need to use fuel, but we must learn to protect ourselves from the ongoing devaluation of the dollar and all fiat currencies in order to ensure we can keep doing what we need to do before our savings are destroyed by the fiat monetary system. |
Breadwinner Economy, Jan 2000 - 2017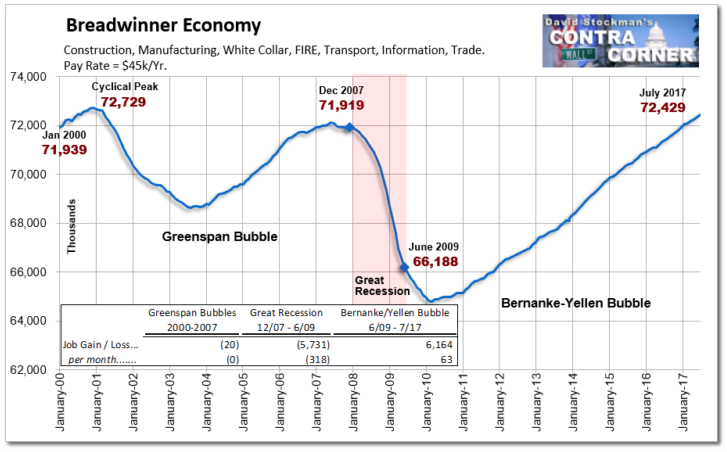 Source: David Stockman via Daily Reckoning - Click to enlarge |
Tags: Consumer Price Index,Daily Market Update,Featured,manipulating silver,newsletter,silver,silver mining