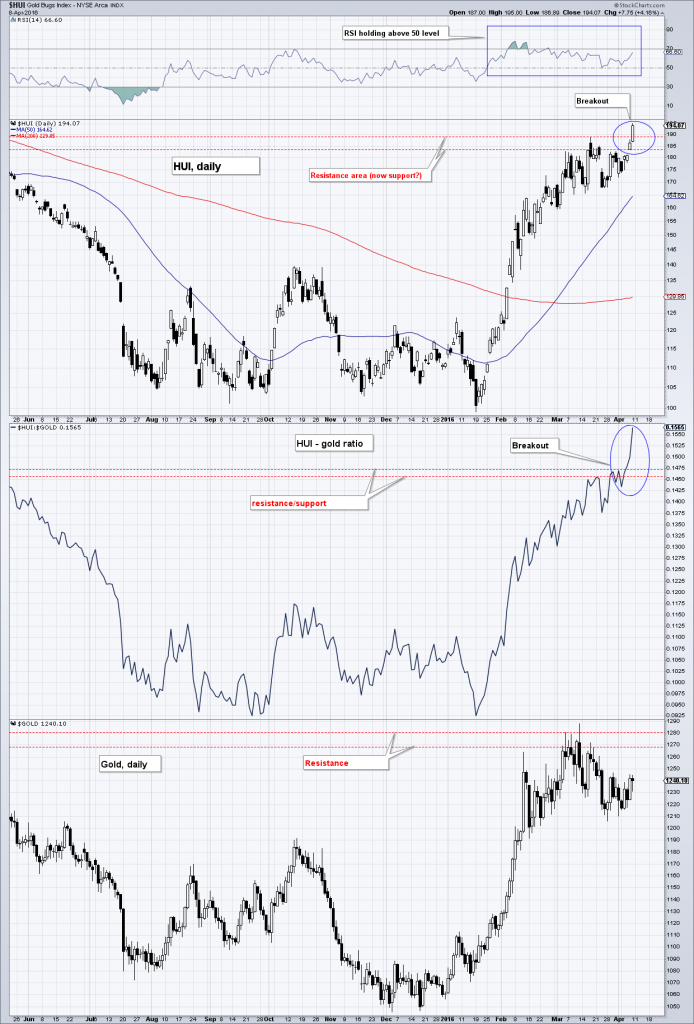
No Correction Yet Photo via Museo del Oro / Bogota Late last week the HUI Index broke out to new highs for the move, and so did the XAU (albeit barely, so it did not really confirm the HUI’s breakout as of Friday). Given that gold itself has not yet broken out to a new high for the move, it would normally be expected to do so, as Jordan Roy-Byrne argues here. The chart below shows the situation as of Friday (HUI, HUI-gold ratio and gold): The HUI and the HUI-gold ratio have broken out above previous highs, while gold has not yet done so as of Friday… as we write this it is somewhat higher again intraday. Note that the HUI’s RSI has held above 50, and turned up again from there, which is generally considered bullish behavior – click to enlarge. We have uploaded a daily chart of the XAU shortly after Monday’s open – this shows that while it had not yet confirmed the breakout on Friday, it was in the process of doing so on Monday, provided the breakout actually holds. XAU, daily: no confirmation on Friday, but it may be put in if Monday’s close is strong – click to enlarge. If the breakout is indeed genuine, the former lateral resistance levels indicated in the charts above should turn into support; moreover, the gold price should indeed confirm the move by breaking out with a lag.
Topics:
Pater Tenebrarum considers the following as important: Chart Update, Featured, Gold and its price, newsletter, Precious Metals
This could be interesting, too:
Nachrichten Ticker - www.finanzen.ch writes Die Performance der Kryptowährungen in KW 9: Das hat sich bei Bitcoin, Ether & Co. getan
Nachrichten Ticker - www.finanzen.ch writes Wer verbirgt sich hinter der Ethereum-Technologie?
Martin Hartmann writes Eine Analyse nach den Lehren von Milton Friedman
Marc Chandler writes March 2025 Monthly
No Correction Yet

Photo via Museo del Oro / Bogota
Late last week the HUI Index broke out to new highs for the move, and so did the XAU (albeit barely, so it did not really confirm the HUI’s breakout as of Friday). Given that gold itself has not yet broken out to a new high for the move, it would normally be expected to do so, as Jordan Roy-Byrne argues here.
The chart below shows the situation as of Friday (HUI, HUI-gold ratio and gold):
We have uploaded a daily chart of the XAU shortly after Monday’s open – this shows that while it had not yet confirmed the breakout on Friday, it was in the process of doing so on Monday, provided the breakout actually holds.
| XAU, daily: no confirmation on Friday, but it may be put in if Monday’s close is strong – click to enlarge. | 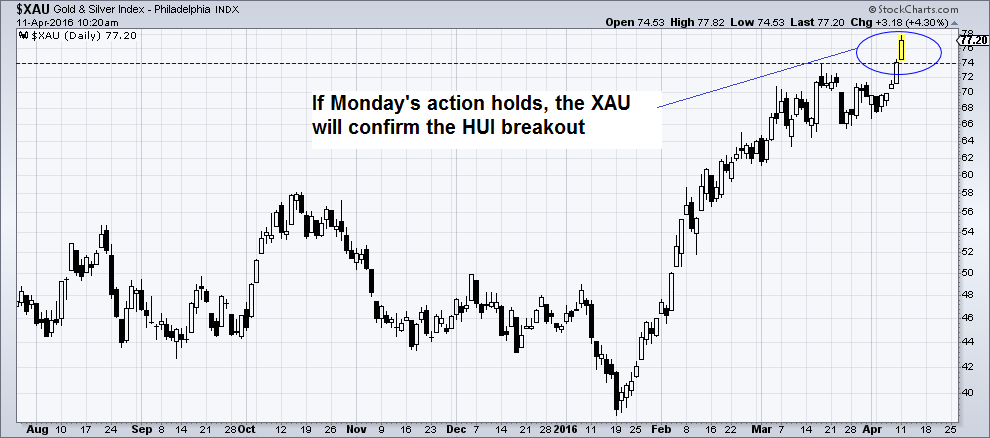 |
If the breakout is indeed genuine, the former lateral resistance levels indicated in the charts above should turn into support; moreover, the gold price should indeed confirm the move by breaking out with a lag. There is still a technical “price attractor” for gold just above the $1300 level from a previous rally attempt that found resistance there in early 2015.
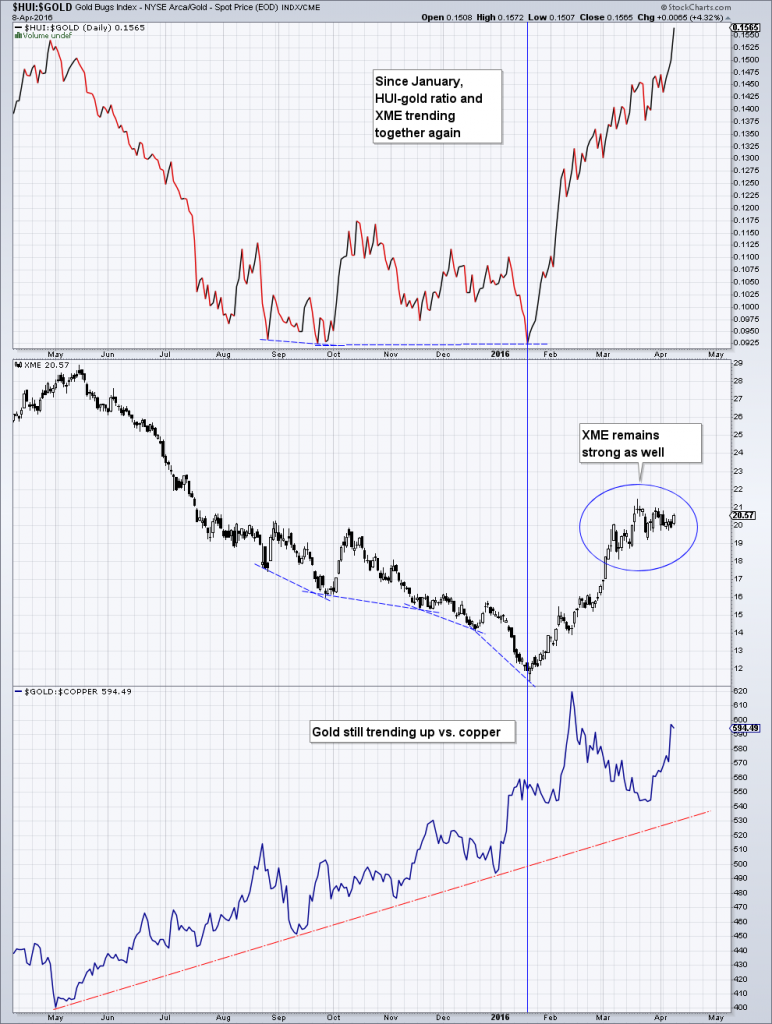
Why even harbor doubts about the breakout? One reason is that it is still fresh, although it certainly looks convincing so far. Another reason is the persistent correlation between the HUI-gold ratio and the XME (industrial metals stocks ETF) which we have previously discussed in these pages (see chart further below). However, when we looked at the change in the sector’s character in late March, we also noted:
“[O]verbought conditions have so far been relieved by means of an upwardly skewed sideways move instead of a sharp dip. One can see this quite well on a 30 minute chart of the HUI that shows the action over the past three months. We haven’t yet given much thought to a possible Elliott wave labeling, but it seems to us that there has to be a “running correction” in there somewhere. This is to say, a corrective structure that exhibits an upside bias and is characterized by continuing the pattern of higher highs and higher lows.
This kind of correction is considered evidence of a very strong underlying trend, as it reflects the urgency of investors to get in.
[…]
A fairly sizable correction certainly wouldn’t be a surprise, but as long as short term support levels remain unmolested, it is still possible that a move to new highs will happen first.”
Here is a comparison chart showing the XAU-gold ratio, XME and the gold-copper ratio. Since mid-January, the former two have been in synch again, which indicates that gold stocks are since then driven by similar investor perceptions as other mining and commodity stocks (and emerging markets, for that matter).
This correlation is something one needs to be aware of. Since it currently still persists, it will presumably also be an important facet of the correction when it finally arrives. The perception driving all of these moves seems to have a lot to do with US economic weakness in Q1 – the Atlanta Fed’s GDPNow indicator has just declined to a mere 0.1% – and the conclusion that the Fed will therefore continue to stand pat with respect to rate hikes.
| GDPNow for the first quarter has recently declined to just 0.1% | 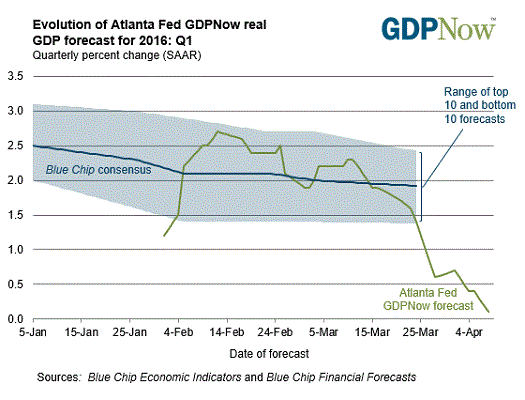 |
Consequently, many “anti US dollar” trades have gained in popularity, ranging from gold to emerging market stocks and currencies, commodity currencies (CAD, XAD, ZAR), commodities and the stocks of commodity producers. All of these are “relative value” plays as well – since these sectors were previously crushed, they have begun to look very attractively priced relative to various momentum sectors such as e.g. technology stocks (in the widest sense) or biotech stocks.
Gold Sentiment and Positioning
Last week we posted an article entitled “Gold – Still Misunderstood”, in which we said that we would soon discuss gold sentiment. In his WSJ article on gold, “A Warning for Gold Bugs: This Rally Won’t Last ”, Steven Russolillo inter alia asserted that sentiment on gold had become too bullish – which he sought to demonstrate by linking to a number of articles arguing the bullish case.
However, bullish sentiment always increases when prices go up. We recently posted links to a number of bearish articles in the context of the question of how to best interpret the commitments of traders report (scroll down to “interpreting the CoT data” for details on this). At any given time, one can find both bullish and bearish articles, with their relative preponderance largely dependent on the most recent price trend.
The question is though, what is sentiment really like? Most of the bearish views we have come across in recent weeks have focused on the CoT report and the large speculative net long position it shows (large relative to recent history). Recent examples of this can e.g. be seen here and here; or they were otherwise representative of the bear market mindset that is still surprisingly prevalent.
We have already said what there was to say about futures positioning. Today we are going to take a look at different sentiment and positioning indicators. We expected these to look “stretched” as well by now, but they actually don’t. Here is a chart of gold, the discounts to NAV of CEF and GTU, as well as Rydex precious metals fund asset levels and net cash inflows.
| Gold, CEF and GTU discounts to NAV, total Rydex precious metals assets and net cash inflows in the Rydex precious metals fund – click to enlarge. | 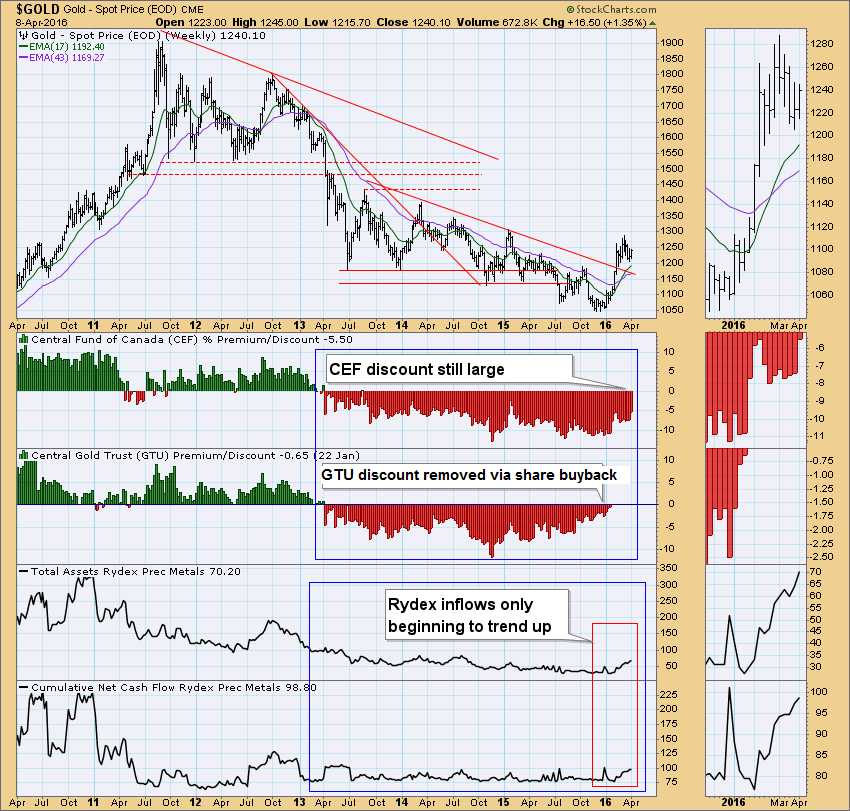 |
GTU and CEF are closed-end funds investing in bullion (the latter invests in both gold and silver). They tend to trade at discounts to their NAV when sentiment is bearish, and at premiums when it is bullish. GTU’s discount to NAV has been eliminated due to a takeover offer from Sprott, that will mop up its shares and make GTU part of Sprott’s PHYS trust.
However, we may assume that CEF’s stock price relative to NAV still reflects sentiment (at least to some degree – note that CEF may also suffer due to competition from other bullion ETFs). CEF’s NAV discount has narrowed, but there is definitely no enthusiasm in evidence yet.
The same holds for the Rydex precious metals fund (which invests in gold and silver stocks). Inflows into the fund have resumed, but are very small so far. In fact, the fund’s assets and net cash inflows are still a far cry from the amounts that were seen during the 2001-2011 bull market period.
In short, these indicators are all saying that traders remain quite wary of the recent rally in gold and gold stocks. The same remains true of small speculators in COMEX gold futures: the overall net speculative position has mainly increased due to the activities of large traders. Non-reportable traders still only hold a net long position of slightly more than 16K contracts (which is a long way from previous highs above 60K contracts net).
Lastly, the Optix indicator by sentimentrader, which combines the most popular survey data with positioning data, also shows no great enthusiasm for gold yet – it remains well below the “excessive optimism” threshold:
| The gold optimism index: at a recent 64 points, it has still not reached “excessive optimism” territory – click to enlarge. | 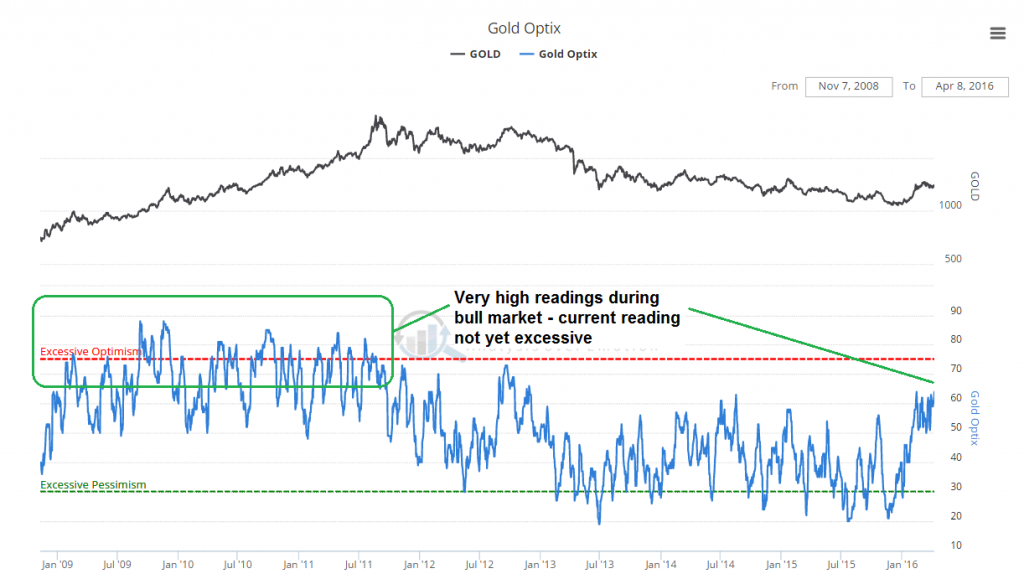 |
Conclusion
Based on price action, resp. technical conditions and the state of sentiment and positioning, the recent rally continues to deserve the benefit of the doubt. At some point a sharp pullback will definitely occur though. Historically, we have seen the sector retest its 50- and 200-day moving averages, as well as various lateral support levels with some regularity during bull markets.
One therefore needs to have a plan in place as to how to deal with the inevitable eventual setback. As a final remark to this, note that in the early stages of the rally beginning in late 2000, the sector put in its first noteworthy interim peak when gold finally confirmed its rally.
Charts by: StockCharts, Atlanta Federal Reserve, SentimenTrader

