Ye olde tattered Crash Alert flag… should it be unfurled again? Image by fmh Black-and-Blue Crash Alert Flag Let us begin the week “on message.” The Diary is about money. Today, we’ll stick to the subject. Old friend Mark Hulbert has done some research on the likelihood of a crash in the stock market. Writing in Barron’s, he points out that the risk – or, more properly, the incidence – of crashes, historically, has been very small: “[…] consider that the 1987 and 1929 crashes were the two worst one-day plunges since the Dow Jones Industrial Average was created in 1896. Given that there have been more than 32,000 trading sessions since then, the judgment of at least this swath of history is that in any given six-month period, there is a 0.79% chance of a daily crash that severe. And there’s no reason to believe that the frequency of future crashes will be significantly higher. Xavier Gabaix, a finance professor at New York University, has derived a crash-frequency formula that he believes captures a universal trait of all markets, not just equity markets or those in the U.S. According to that formula, the odds of a 12.8% crash in any given six-month period are 0.92%, almost as low as the actual frequency in the U.S. stock market over the last century.
Topics:
Bill Bonner considers the following as important: Debt and the Fallacies of Paper Money, Dow Jones, Featured, Mark Hulbert, newsletter, Nikkei Index, On Economy, On Politics
This could be interesting, too:
Nachrichten Ticker - www.finanzen.ch writes Die Performance der Kryptowährungen in KW 9: Das hat sich bei Bitcoin, Ether & Co. getan
Nachrichten Ticker - www.finanzen.ch writes Wer verbirgt sich hinter der Ethereum-Technologie?
Martin Hartmann writes Eine Analyse nach den Lehren von Milton Friedman
Marc Chandler writes March 2025 Monthly
Black-and-Blue Crash Alert Flag
Let us begin the week “on message.” The Diary is about money. Today, we’ll stick to the subject. Old friend Mark Hulbert has done some research on the likelihood of a crash in the stock market.
Writing in Barron’s, he points out that the risk – or, more properly, the incidence – of crashes, historically, has been very small:
“[…] consider that the 1987 and 1929 crashes were the two worst one-day plunges since the Dow Jones Industrial Average was created in 1896. Given that there have been more than 32,000 trading sessions since then, the judgment of at least this swath of history is that in any given six-month period, there is a 0.79% chance of a daily crash that severe.
And there’s no reason to believe that the frequency of future crashes will be significantly higher. Xavier Gabaix, a finance professor at New York University, has derived a crash-frequency formula that he believes captures a universal trait of all markets, not just equity markets or those in the U.S. According to that formula, the odds of a 12.8% crash in any given six-month period are 0.92%, almost as low as the actual frequency in the U.S. stock market over the last century.
This means that the average investor over the last three decades has believed a severe crash to be more than 24 times more likely than U.S. history would suggest, and that investors currently believe the risks to be 28 times more likely.”
Whoa! Are investors idiots, or what? Maybe not. Your editor is among those who happily over-estimate the risk of a crash. He expected one in 1998…and again in 1999…and when it came in 2000, he was as surprised as anyone.
Then, prices went up again. And again, he raised the old black-and-blue Crash Alert flag. In 2005… in 2006… in 2007… finally, in 2008, he got what he expected. And now that the market has recovered again, he expects another one.
Investors and Turkeys
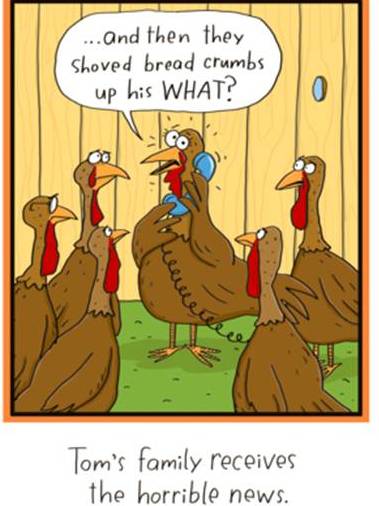
Statistically, as Mark points out, the likelihood of a crash coming on any given day is small. But that is a little like telling a turkey not to worry because the likelihood of Thanksgiving is only 1 out of 365.
Eventually, all turkeys and all investors get whacked. And, generally, the longer a market goes without a correction, the more it needs one. Besides, there is something a little fishy about these numbers.
In the last 20 years, there were the aforementioned sell-offs in the stock market – one in 2000, heavily concentrated in the Nasdaq and the other across the board in 2008. But people don’t think of investing in terms of avoiding the specific day of crash.
Investors don’t really care if a crash happens on a Wednesday or a Thursday. If they think a crash will happen any time within six months, they usually want to stay out of the market – realizing that they can’t time these sorts of things with any precision. So if we look at it in these terms, there were 40 six-month periods in the last 20 years. And crashes happened in two of them – or one in 20.
If investors truly believed that the odds of a crash were 28 times higher than one in 20, they would have believed that there would be a crash every six months. And they would have been out of stocks all the time.

You don’t want this to happen, even if the chances that it will are fairly small… Cartoon by American Greetings
It’s Like Russian Roulette
Also, the statistics Mark cites do not really gauge the “risk” of a crash. They speak only to the frequency. Imagine the drunken imbecile who puts a bullet into a revolver, spins the chamber, and puts the gun to his temple.

Statistically speaking, Lady Luck is likely to be on your side in Russian Roulette…but it’s probably still not the best idea to do it. Image credit: Ant Baena
The typical investor is in his 50s. If the next stock crash is followed by a big bounce, like the other two crashes in the last 20 years. He will be glad he paid no attention to our warnings and just kept his money in stocks.
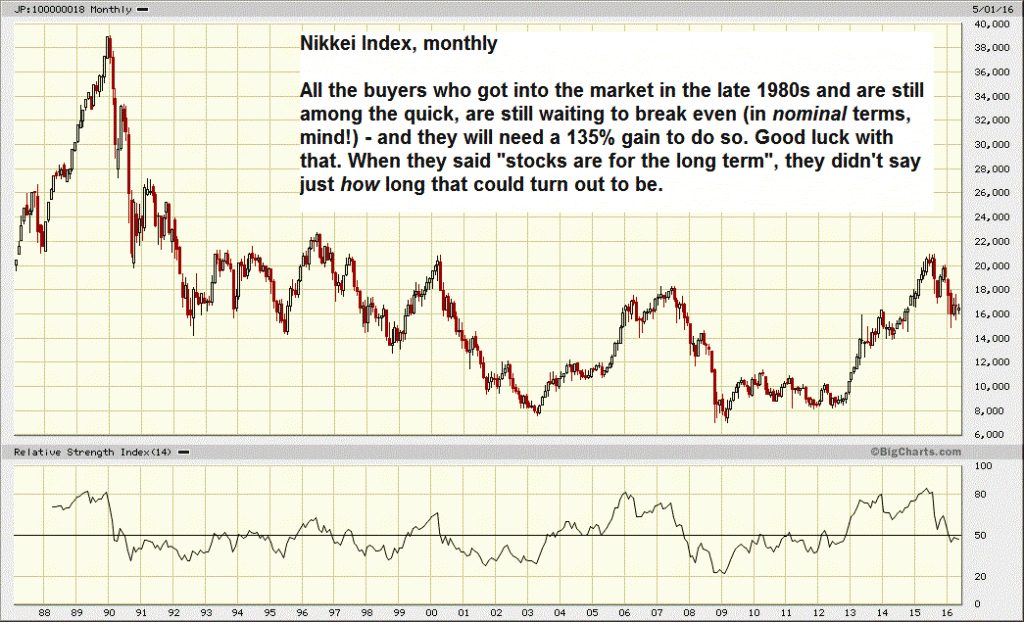
But what if the stock market crash of 2016 is more like the crash of 1929, or the bear market of ’66? He could have to wait 20 years to break even. Or if it is like the crash that happened in Japan in 1990, he’ll still be waiting in 2042.
Nikkei Index, monthlyThe Nikkei, monthly since 1987. It’s been a long wait, and the waiting continues…most buy and hold investors who got into the market in the late 80s are only likely to reach breakeven in the afterlife. |
Chart by: BigCharts
Chart and image captions by PT
The above article originally appeared at the Diary of a Rogue Economist, written for Bonner & Partners.


