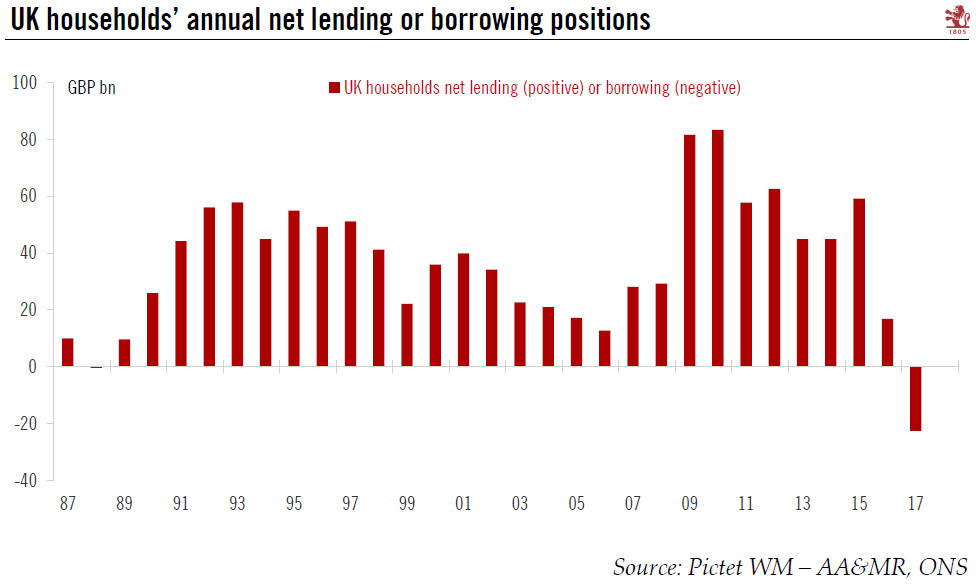
ONS data suggest that UK households lived beyond their means in 2017 as they became net borrowers for the first time in nearly 30 years.The latest UK sectoral accounts from the Office for National Statistics (ONS) has received considerable attention over the past few days as it shows UK households’ outgoings surpassed their income in 2017 for the first time in nearly 30 years. The ONS noted that, on average, each UK household spent or invested around GBP 900 more than it received in income in 2017, or GBP 23 bn for the country as a whole. Detailed financial accounts revealed that to fund this shortfall, UK households borrowed more, including around GBP 80 bn in bank loans last year (the highest amount in ten years) and saved less, depositing just GBP 37 bn with UK banks (the lowest amount
Topics:
Frederik Ducrozet considers the following as important: Europe chart of the week, Macroview, UK households
This could be interesting, too:
Cesar Perez Ruiz writes Weekly View – Big Splits
Cesar Perez Ruiz writes Weekly View – Central Bank Halloween
Cesar Perez Ruiz writes Weekly View – Widening bottlenecks
Cesar Perez Ruiz writes Weekly View – Debt ceiling deadline postponed
ONS data suggest that UK households lived beyond their means in 2017 as they became net borrowers for the first time in nearly 30 years.
The latest UK sectoral accounts from the Office for National Statistics (ONS) has received considerable attention over the past few days as it shows UK households’ outgoings surpassed their income in 2017 for the first time in nearly 30 years. The ONS noted that, on average, each UK household spent or invested around GBP 900 more than it received in income in 2017, or GBP 23 bn for the country as a whole. Detailed financial accounts revealed that to fund this shortfall, UK households borrowed more, including around GBP 80 bn in bank loans last year (the highest amount in ten years) and saved less, depositing just GBP 37 bn with UK banks (the lowest amount in seven years).
Households’ borrowing and lending decisions depend largely on their wealth. The ONS noted that the poorest decile of households spent two-and-a-half times their disposable income in 2017, while the richest 10% spent less than half. The UK situation is almost unique among developed economies, with the notable exception of Canada.
Some caution is warranted when looking at these data. The Bank of England (BoE) warned that the figures have been revised in the past, and that the 2017 deficit could potentially be revised into positive territory. Meanwhile, the BoE’s decision to raise interest rates to 0.75% this week is unlikely to change households’ borrowing behaviour dramatically, but the Bank said that it is looking carefully at the private sector’s ability to shoulder rate increases over the coming years. In all, the increase in household debt is another argument for the Bank to proceed very carefully with monetary tightening.