The US economy was not firing on all cylinders in 2017, but this could change with the tax cuts.This is a good time to take stock of how well the US economy did in 2017. Assuming Q4 GDP is in line with the current estimate from the Atlanta Fed (which is close to our own), 2017 growth will be 2.3%. This would mark a step-up from annual growth of 1.5% in 2016 – when the sharp drop in oil prices hit investment and the wider economy hard – but would be close to the growth trajectory seen since the beginning of the recovery (average of 2.2% GDP growth).This 2017 average of 2.3% masks an improvement in tempo since Q2-2017, since when quarterly GDP has been consistently above 3%. This solid momentum looks set to have carried over into 2018, providing a solid impetus for 2018 annual growth.It is
Topics:
Thomas Costerg considers the following as important: Macroview, US animal spirits, US GDP, US growth metrics, US tax cuts
This could be interesting, too:
Cesar Perez Ruiz writes Weekly View – Big Splits
Cesar Perez Ruiz writes Weekly View – Central Bank Halloween
Cesar Perez Ruiz writes Weekly View – Widening bottlenecks
Cesar Perez Ruiz writes Weekly View – Debt ceiling deadline postponed
The US economy was not firing on all cylinders in 2017, but this could change with the tax cuts.

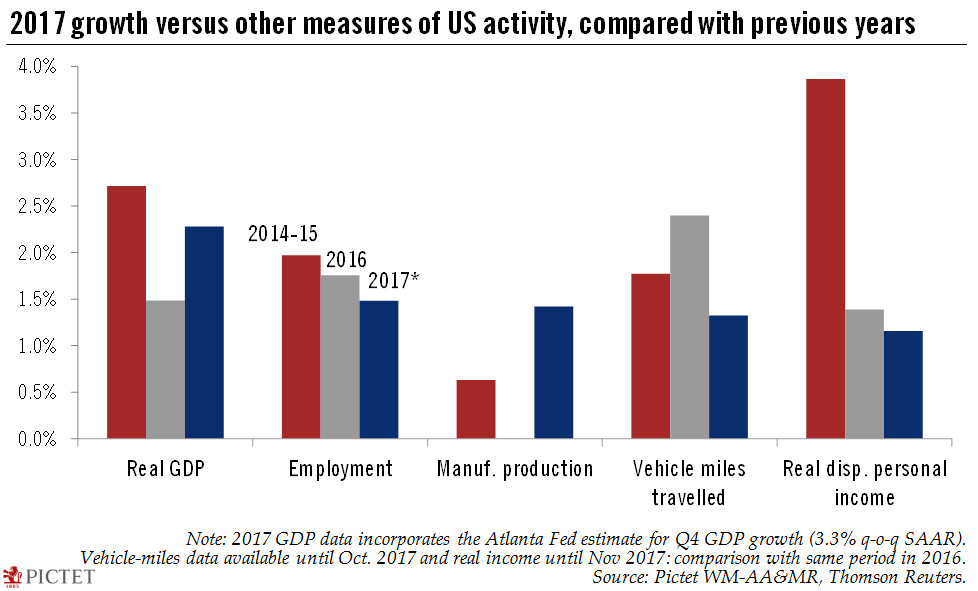
This is a good time to take stock of how well the US economy did in 2017. Assuming Q4 GDP is in line with the current estimate from the Atlanta Fed (which is close to our own), 2017 growth will be 2.3%. This would mark a step-up from annual growth of 1.5% in 2016 – when the sharp drop in oil prices hit investment and the wider economy hard – but would be close to the growth trajectory seen since the beginning of the recovery (average of 2.2% GDP growth).
This 2017 average of 2.3% masks an improvement in tempo since Q2-2017, since when quarterly GDP has been consistently above 3%. This solid momentum looks set to have carried over into 2018, providing a solid impetus for 2018 annual growth.
It is always useful to cross-check GDP against alternative measures of activity. Interestingly, most of these measures underperformed GDP last year, ranging from 1.2% growth in real disposable personal income (down from 1.4% in 2016), 1.3% in growth in vehicle miles travelled (down from 2.4% in 2016), 1.4% in manufacturing production (a step-up from 0% in 2016) and 1.5% growth in employment (down from 1.8% in 2016).
Of these metrics, personal income data is perhaps the one to monitor the most as we kick off 2018. There are signs that the Trump administration’s newly-enacted tax cuts may have – finally – activated ‘animal spirits’. These could in turn open the door for a stepped-up growth trajectory, with mutually reinforcing growth in investment, consumption and wages.
