We revise down our GDP growth forecasts from 2.5% to 2.2% for Q3, and from 2.9% to 2.6% for Q4. Our forecast for 2015 remains unchanged at 2.5% whilst our forecast for 2016 is mechanically cut from 2.5% to 2.4%. September’s report was weak on all fronts. Job creation came in below expectations, numbers for previous months were revised down, wages were flat m-o-m and the proxy for household wage incomes fell m-o-m. We now believe the most likely scenario is for the Fed to wait till March before hiking rates. Softer employment growth in Q3 Non-farm payroll employment rose by 142,000 m-o-m in September 2015, below consensus expectations (201,000). Moreover, August’s figure was revised down (from 173,000 to 136,000), as was July’s number (from 245,000 to 223,000). Cumulative net revisions thus worked out at a negative 59,000. As a result, overall in Q3, job creation slowed to an average of 167,000, noticeably lower than the average in H1 (213,000). These numbers were clearly disappointing and, following the news, US long-term rates, equities and the dollar dropped markedly. However, this negative surprise should not be overstated. Monthly job creations are very volatile in the short run (see chart above) and are often significantly revised. Moreover, a job increase of 142,000 (the figure published for September) is equivalent to a rise in employment of 0.
Topics:
Bernard Lambert considers the following as important: Macroview
This could be interesting, too:
Cesar Perez Ruiz writes Weekly View – Big Splits
Cesar Perez Ruiz writes Weekly View – Central Bank Halloween
Cesar Perez Ruiz writes Weekly View – Widening bottlenecks
Cesar Perez Ruiz writes Weekly View – Debt ceiling deadline postponed
We revise down our GDP growth forecasts from 2.5% to 2.2% for Q3, and from 2.9% to 2.6% for Q4. Our forecast for 2015 remains unchanged at 2.5% whilst our forecast for 2016 is mechanically cut from 2.5% to 2.4%.
September’s report was weak on all fronts. Job creation came in below expectations, numbers for previous months were revised down, wages were flat m-o-m and the proxy for household wage incomes fell m-o-m. We now believe the most likely scenario is for the Fed to wait till March before hiking rates.
Softer employment growth in Q3
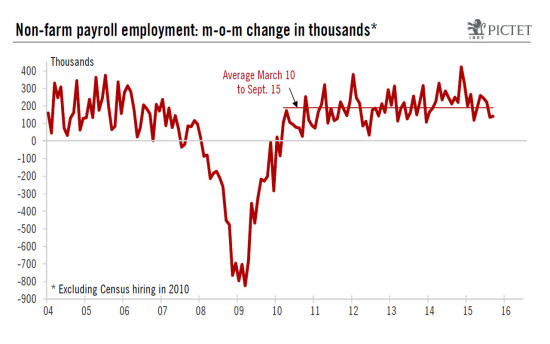
Non-farm payroll employment rose by 142,000 m-o-m in September 2015, below consensus expectations (201,000). Moreover, August’s figure was revised down (from 173,000 to 136,000), as was July’s number (from 245,000 to 223,000). Cumulative net revisions thus worked out at a negative 59,000. As a result, overall in Q3, job creation slowed to an average of 167,000, noticeably lower than the average in H1 (213,000).
These numbers were clearly disappointing and, following the news, US long-term rates, equities and the dollar dropped markedly. However, this negative surprise should not be overstated. Monthly job creations are very volatile in the short run (see chart above) and are often significantly revised. Moreover, a job increase of 142,000 (the figure published for September) is equivalent to a rise in employment of 0.10% m-o-m, whereas an increase of 201,000 (what was expected) implies a rise of 0.16% m-o-m, not a tremendous difference.
Unemployment rate stabilises at a touch above 5.0%
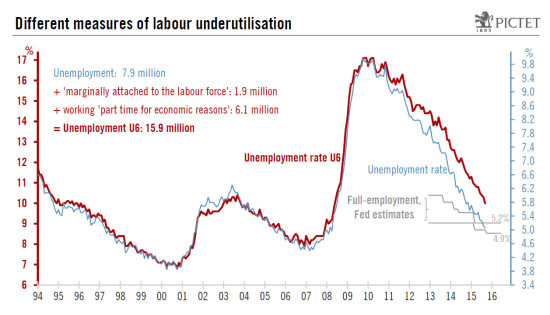
Meanwhile, the unemployment rate remained stable at 5.1% (5.051% before rounding), in line with consensus expectations. However, a more in-depth look at the household survey (the basis for calculating the unemployment rate) reveals that this stability was far from linked to positive employment numbers. In fact, employment as measured in the household survey – an often very volatile statistic – fell by a substantial 236,000 m-o-m in September, following a 196,000 increase in August. However, at the same time, the size of the labour force shrank by an even bigger 350,000 m-o-m, following a 41,000 drop in August. The end-result was that the number of unemployed dropped by 114,000 (-350,000 minus -236,000) while the participation rate (the proportion of the adult population working or looking for a job) fell further from 62.6% in August to 62.4% in September. This means that the small decline in unemployment was just the result of a sharp drop in the labour force and happened despite a contraction in employment.
Nevertheless, at 5.1%, the unemployment rate is just beneath the top end of the range the Fed feels corresponds to full employment (4.9%-5.2%). Moreover, it is worth remembering that this latter range was lowered from 5.0%-5.2% as recently as two weeks ago.
The Fed has admittedly repeated many times that the unemployment rate probably underestimates the amount of resources available in the labour market. However, even if we consider a wider measure of unemployment, i.e. the U6 measure – which includes (1) employees working part-time, but who would prefer a full-time job, and (2) people who want a job, are available for work, have looked for a job sometime over the past 12 months, but did not do so during the current survey week and were therefore not counted as unemployed – it fell heavily in H1 2015. And it has declined further in Q3, falling from 10.5% in June to 10.3% in August, and now to 10.0% in September. On this yardstick too, full employment does not look all that far away (see chart above).
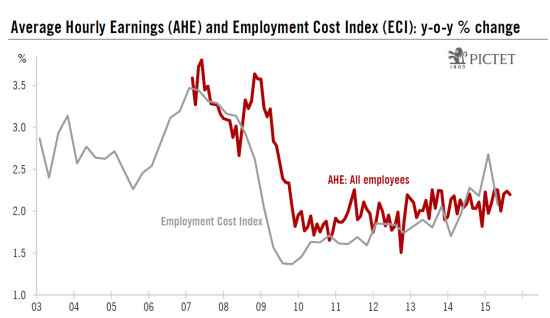
Meanwhile, average hourly earnings were flat m-o-m in September, below consensus estimates (+0.2%). However, the figure for August was revised up from +0.3% to +0.4%. On a y-o-y basis, wage increases remained stable at 2.2%. This series is quite volatile (see next chart), but, according to these numbers, the pace of wage increases looks to have remained on a flat trend so far this year, with monthly y-o-y increases hovering around a modest 2.2%.
These results are pointing in the same direction as the quarterly Employment Cost Index (ECI) – the most reliable measure of wages and salaries – i.e. to no noticeable acceleration in wage increases so far this year. However, we continue to expect wage increases to gradually pick up further over the coming few quarters.
The average working week fell back in September
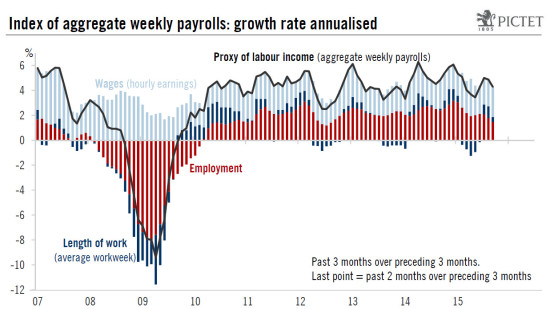
The average workweek was published at 34.5 hours in September, down from 34.6 hours in July and August. This represents another discouraging sign. In terms of total hours worked, an increase of 0.1 hours is equivalent to some 350,000 jobs being created. However, it is worth noting that the average workweek was also at 34.5 hours on average in Q2.
As a result of all this, the index of ‘aggregate weekly payrolls’ (calculated as a product of aggregate hours worked and average hourly earnings) declined by 0.2% m-o-m in September, after +0.5% in August (revised down from +0.7%). Nevertheless, this index – which is a good proxy for nominal household income coming in the form of private wages and salaries – grew by a robust 4.9% q-o-q annualised in Q3, after a softer 3.4% q-o-q annualised in Q2. This was quite a supportive development for growth in household income in Q3, and for consumer spending. However, the monthly decline recorded in September means that the entry point into Q4 will be soft.
We now expect the Fed to hike in March 2016
Today’s employment report was surprisingly weak. It is always risky to elaborate too much on a single month’s report. However, since the Fed met on 16-17 September, stress has remained intense in the financial markets, market-based inflation expectations have fallen further, financial conditions have tightened further and concerns on Chinese and world growth prospects remain unabated. Moreover, although a resolution was voted at the eleventh hour earlier this week to avoid a government shutdown, the new deadline is 11 December, roughly at the same time when the debt ceiling should be reached. This means that political stress may well rise quite abruptly once again just before the December FOMC meeting (9-10 December). Against this backdrop, we now believe the most likely scenario is that the Fed will wait until March 2016 before starting to hike rates.
On the growth front, some other important economic data have been published. Car sales were quite strong in September, reaching a new high for this cycle. However, the ISM manufacturing index fell to 50.2 in September and the preliminary August report on trade was very weak, with nominal exports of goods falling by 3.2% m-o-m whilst imports rose by 2.2%. Following these data, and today’s employment report, we are revising down our GDP growth forecasts from 2.5% to 2.2% for Q3, and from 2.9% to 2.6% for Q4. On a yearly average basis, our forecast for 2015 remains unchanged at 2.5% whilst our forecast for 2016 is mechanically cut from 2.5% to 2.4%.


