 Swiss Economicblogs.org
To analyze the transmission from interest rate policies to output and inflation, many academics and central bank economists use the basic New Keynesian (NK) ‘three-equation model’ and its various extensions. A key factor responsible for the model’s success is the seeming alignment with conventional wisdom—some of the model features can be framed in the language of familiar business cycle narratives, as found in newspapers, central bank communication, or introductory macroeconomics...
Read More »The Big One, The Smoking Gun
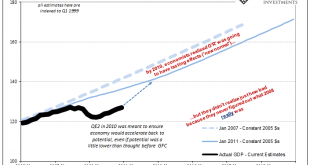
It wasn’t just the unemployment rate which was one of the key reasons why Economists and central bankers (redundant) felt confident enough to inspire 2017’s inflation hysteria. There was actually another piece to it, a bigger piece potentially complimentary and corroborative bit of conjecture. I write “conjecture” because despite how all this is presented in the media there’s very little precision to any of it. In many ways, if you pay close enough attention you...
Read More »Where the Phillips Curve is Alive, Contd
In an NBER working paper, Laurence Ball and Sandeep Mazumder question the puzzles of first, missing disinflation and subsequently, missing inflation in the Euro area. From the abstract: … we measure core inflation with the weighted median of industry inflation rates, which is less volatile than the common measure of inflation excluding food and energy prices. We find that fluctuations in core inflation since the creation of the euro are well explained by three factors: expected inflation...
Read More »Where the Phillips Curve is Alive
In an NBER working paper, James Stock and Mark Watson argue that the correlation between cyclically sensitive inflation (CSI) and bandpass filtered activity measures is high and has not declined over the last decades, contrary to standard measures of the slope of the Phillips curve. … we construct a new price index designed to maximize the cyclical variation in the price index. This index, which we call Cyclically Sensitive Inflation (CSI), estimates the weights on the component prices...
Read More »Downslope CPI
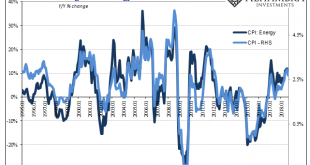
Cushing, OK, delivered what it could for the CPI. The contribution to the inflation rate from oil prices was again substantial in August 2018. The energy component of the index gained 10.3% year-over-year, compared to 11.9% in July. It was the fourth straight month of double digit gains. Yet, the CPI headline retreated a little further than expected. After reaching the highest since December 2011 the month before,...
Read More »Euro area wage growth suggests the Phillips curve is not dead
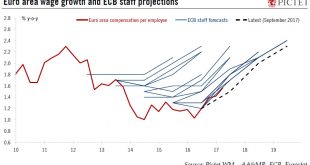
The latest signs that wages are picking up together with drops in unemployment should help push the ECB along the road of policy normalisation.Wage growth is an important input in the ECB’s reaction function, and so far it has failed to respond to the narrowing of the output gap. It could be the normal behaviour of a lagging indicator, especially as labour market slack is likely to be larger than what the drop in headline unemployment would suggest. Or, it could be that “the slope of the...
Read More »The Swiss Phillips Curve
On VoxEU, Stefan Gerlach reviews the case for tilting Phillips curves in Switzerland. Previous research had suggested that the Swiss Phillips curve had steepened in the second half of the 20th century. Gerlach estimates a Phillips curve model that includes lagged inflation, an output gap measure, and a measure of import price inflation. His model suggests several structural breaks: The first structural break occurs in 1936-37. The estimated Phillips curves indicate that inflation became...
Read More »Serious Flaws in ECB’s Economic Thinking

(Originally published in December 2015) In December 2015, the ECB announced a further „easing“ of monetary policy. In order to stimulate the economy in the euro zone you will take the following measures: First, the ECB will cut its deposit rate from -0.2 per cent to -0.3 per cent. Second, the rate for main refinancing operations will remain unchanged at 0.05 per cent. Third, the ECB will expand its stimulus program by...
Read More »