Jeffrey P. Snider
September 28, 2018
SNB & CHF
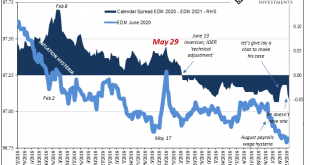
June 13 sticks out for both eurodollar futures as well as IOER. On the surface, there should be no bearing on the former from the latter. They are technically unrelated; IOER being a current rate applied as an intended money alternative. Eurodollar futures are, as the term implies, about where all those money rates might fall in the future.
Still, the eurodollar curve inverted conspicuously starting June 13. That was...
Read More »
Jeffrey P. Snider
September 16, 2018
SNB & CHF
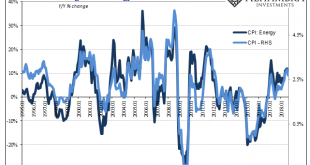
Cushing, OK, delivered what it could for the CPI. The contribution to the inflation rate from oil prices was again substantial in August 2018. The energy component of the index gained 10.3% year-over-year, compared to 11.9% in July. It was the fourth straight month of double digit gains.
Yet, the CPI headline retreated a little further than expected. After reaching the highest since December 2011 the month before,...
Read More »
Jeffrey P. Snider
September 15, 2018
SNB & CHF
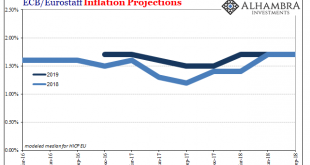
Mario Draghi doesn’t have a whole lot going for him, but he is at least consistent – at times (yes, inconsistent consistency). Bloomberg helpfully reported yesterday how the ECB’s staff committee that produces the econometric projections has recommended the central bank’s Governing Council change the official outlook. Since last year, risks have been “balanced” in their collective opinion.
Given what’s happened this...
Read More »
Jeffrey P. Snider
September 14, 2018
SNB & CHF
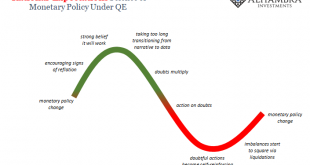
We’ve been here before. Economists and central bankers become giddy about the prospects for success, meaning actual recovery. For that to happen, reflation must first attain enough momentum. If it does, as is always forecast, reflation becomes recovery. The world then moves off this darkening path toward the unknown crazy.
The problem has been that officials mistake reflation for what it is. Each time they believe it...
Read More »
Jeffrey P. Snider
September 2, 2018
SNB & CHF
The US yield curve isn’t the only one on the precipice. There are any number of them that are getting attention for all the wrong reasons. At least those rationalizations provided by mainstream Economists and the central bankers they parrot. As noted yesterday, the UST 2s10s is now the most requested data out of FRED. It’s not just that the UST curve is askew, it’s more important given how many of them are.
Look to our...
Read More »
Jeffrey P. Snider
August 29, 2018
SNB & CHF
Effective federal funds (EFF) was 1.92% again yesterday. That’s now eight in a row just 3 bps underneath the “technically adjusted” IOER. If indeed the FOMC has to make another one to this tortured tool we know already who will be blamed for it.
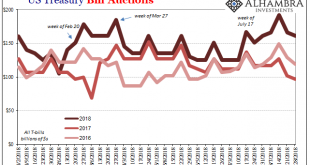
The Treasury Department announced yesterday that it will be auctioning off $65 billion in 4-week bills this week (today). The results showed that dealers submitted $152 billion...
Read More »
Jeffrey P. Snider
August 25, 2018
SNB & CHF
At this particular juncture eight months into 2018, the only thing that will help is abrupt and serious acceleration. On this side of May 29, it is way past time for it to get real. The global economy either synchronizes in a major, unambiguous breakout or markets retrench even more.
That’s been the basis of this thing from Day 1; or, more accurately, Day 3.01. Reflation #3 wasn’t really any different in type from...
Read More »
Jeffrey P. Snider
August 18, 2018
SNB & CHF
Americans are spending more on filling up. A lot more. According the Census Bureau, retail sales at gasoline stations had increased by nearly 20% year-over-year (unadjusted) in both May and June 2018. In the latest figures for July, released today, gasoline station sales were up by more than 21%. The last time they surged this much was September 2011, also the last time oil prices were having this big of an effect on...
Read More »
Jeffrey P. Snider
August 10, 2018
SNB & CHF
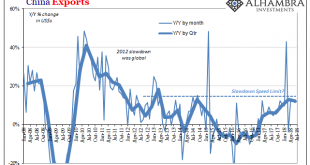
Why is SHIBOR falling from an economic perspective? Simple again. China’s growth both on its own and as a reflection of actual global growth has stalled. And in a dynamic, non-linear world stalled equals trouble.
Going all the way back to early 2017, there’s been no acceleration (and more than a little deceleration). The reflation economy got started in 2016 but it never went anywhere. For most of last year, optimists...
Read More »
Jeffrey P. Snider
July 26, 2018
SNB & CHF
In 1999, real GDP growth in the United States was 4.69% (Q4 over Q4). In 1998, it was 4.9989%. These were annual not quarterly rates, meaning that for two years straight GDP expanded by better than 4.5%. Individual quarters within those years obviously varied, but at the end of the day the economy was clearly booming.
It also helped that these particular two years followed two good ones before them. GDP growth in 1997...
Read More »
 Swiss Economicblogs.org