Let’s ask “cui bono” of the trillion in added debt and the trillion added to GDP: to whose benefit? I’ve been thinking about how hard it is to get our heads around big numbers. Technical analyst Sven Henrich (@NorthmanTrader) recently provided one method to grasp the immense wealth of Elon Musk: How to become as wealthy as Elon Musk? Easy. Get paid Million every single day. For 750 years in a row and you’re there. How can we get a handle on the trillion we’ve added in total debt since 2010? We can start by noting that’s a 60% increase in debt in about a decade, while the population of the U.S. rose by 7%. . Are we 60% better off than we were 12 years ago? How do we measure “better off”? GDP went up by 60% as well, but are we 60% more efficient
Topics:
Charles Hugh Smith considers the following as important: 5.) Charles Hugh Smith, 5) Global Macro, Featured, newsletter
This could be interesting, too:
Nachrichten Ticker - www.finanzen.ch writes Die Performance der Kryptowährungen in KW 9: Das hat sich bei Bitcoin, Ether & Co. getan
Nachrichten Ticker - www.finanzen.ch writes Wer verbirgt sich hinter der Ethereum-Technologie?
Martin Hartmann writes Eine Analyse nach den Lehren von Milton Friedman
Marc Chandler writes March 2025 Monthly
|
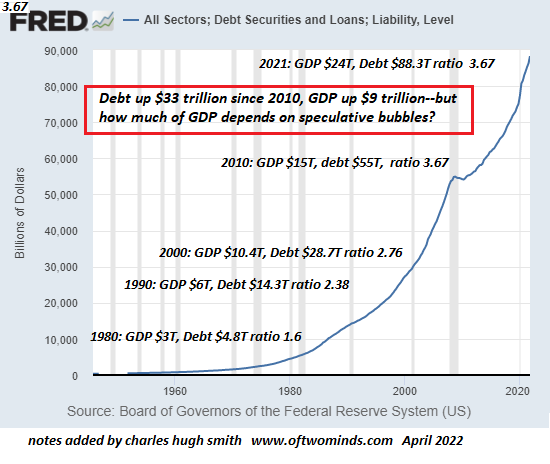
Let’s ask “cui bono” of the $33 trillion in added debt and the $9 trillion added to GDP: to whose benefit? I’ve been thinking about how hard it is to get our heads around big numbers. Technical analyst Sven Henrich (@NorthmanTrader) recently provided one method to grasp the immense wealth of Elon Musk: How to become as wealthy as Elon Musk? Easy. Get paid $1 Million every single day. For 750 years in a row and you’re there. How can we get a handle on the $33 trillion we’ve added in total debt since 2010? We can start by noting that’s a 60% increase in debt in about a decade, while the population of the U.S. rose by 7%. |
|
| Are we 60% better off than we were 12 years ago? How do we measure “better off”? GDP went up by 60% as well, but are we 60% more efficient or 60% more productive? Has the purchasing power of our wages gone up 60%? Can we buy 60% more with a day’s earnings?
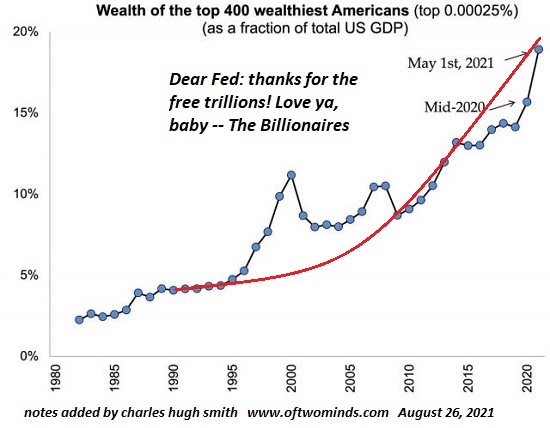
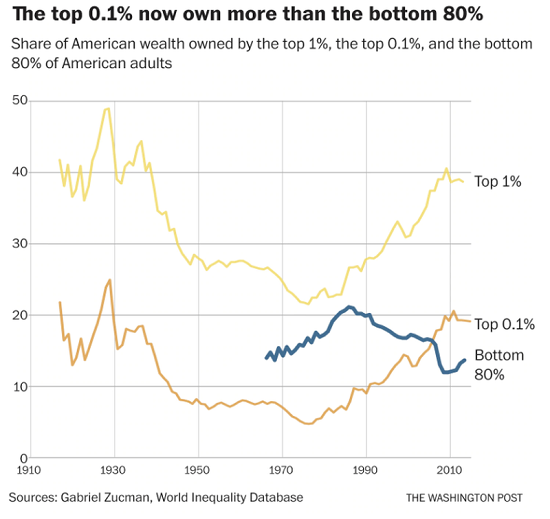
I think it’s fair to say “no” to all these questions. We’ve added $33 trillion in debt to more or less tread water. Does it illuminate the $33 trillion to say that’s $100,000 of debt for every one of the 330 million Americans? Are we each $100,000 better off for borrowing $33 trillion? Well, a few folks have benefitted. The top 400 wealthiest folks have seen their wealth skyrocket by trillions of dollars, from roughly 8% of GDP in 2010–way up from a paltry 2.5% in 1985–to about 18% of GDP, which is now $24 trillion. That works out to $4.3 trillion. |
|
| I think it’s fair to say that hyper-globalization and hyper-financialization has generated hyper-wealth and hyper-inequality.
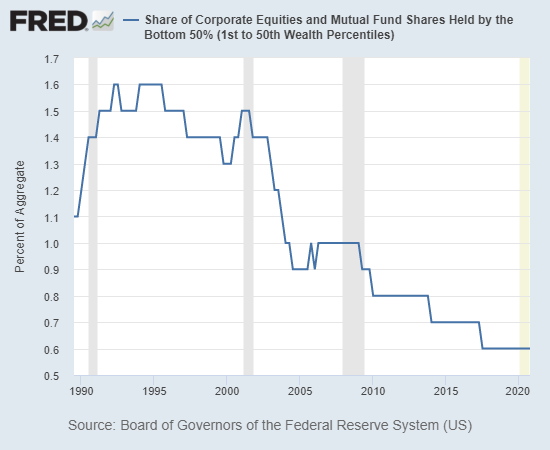
Speaking of big numbers, let’s look at the bottom 50%, roughly 65 million households. As the chart below shows, these 65 million households own about 0.6% of the $40+ trillion U.S. stock market. That’s less than 1%, or around $240 billion. Divvied up amongst 65 million households, that works out to a couple thousand bucks per household. The ownership of stocks in the bottom 50% probably follows the same power law distribution curve as all stock ownership: the top 1% of those 65 million households own most of the stock and all but a thin slice is owned by the balance of the top 5%. |
|
| So the reality is the vast majority of American households have no stake at all in the glorious U.S. stock market’s tens of trillions, or the bond market’s tens of trillions, or the trillions held in privately held enterprises and commercial / rental real estate. | |
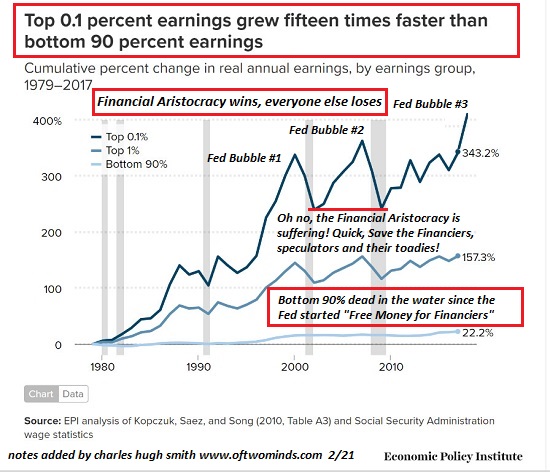
| So let’s ask cui bono of the $33 trillion in added debt and the $9 trillion added to GDP: to whose benefit? I think it;s fair to say the benefits were distributed along a power law distribution in which the top 0.01% skimmed the majority of the gains, the top 0.1% received the next largest chunk, the top 1% collected most of what was left, and the rest of the top 5% (from 1% to 5%) scooped all but a few scraps that fell mostly to the top 6% to 10%. A few crumbs were left for the top 10% to 20%, and below that, only dust motes were left.
I’m not at all sure there is any way to truly grasp hyper-wealth and |
 . |
Tags: Featured,newsletter

