Pandemic Wealth Effect The top 1% of the US made about T or .2M per person. The next 19% made about T or 8,000 per person. The next 30% made about T or ,000 per person. The bottom 50% made about T or ,000 per person. The resulting inflation is at a 40yr high and Powell wants the money back. Let’s recap what happened in the last 2 to 3 years. In addition to the Fed providing liquidity during the pandemic, there was a coordinated effort between the Monetary Authority and the Government where the Monetary Authority funded approximately T in fiscal stimulus between March 2020 and April 2021. The CARES Act (.3T), the CAA-21 (0B) and the American Rescue Plan (.9T) were the 3 main pieces of legislation or appropriation in addition to
Topics:
Douglas R. Terry, CFA considers the following as important: 5.) Alhambra Investments, economy, Featured, Federal Reserve/Monetary Policy, newsletter, Taxes/Fiscal Policy
This could be interesting, too:
Nachrichten Ticker - www.finanzen.ch writes Die Performance der Kryptowährungen in KW 9: Das hat sich bei Bitcoin, Ether & Co. getan
Nachrichten Ticker - www.finanzen.ch writes Wer verbirgt sich hinter der Ethereum-Technologie?
Martin Hartmann writes Eine Analyse nach den Lehren von Milton Friedman
Marc Chandler writes March 2025 Monthly
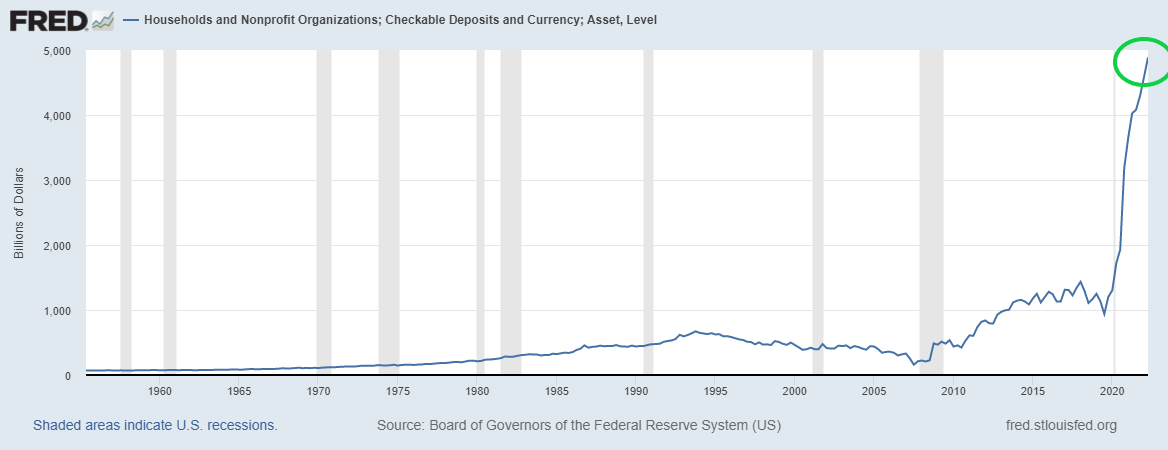
Pandemic Wealth EffectThe top 1% of the US made about $14T or $4.2M per person. The next 19% made about $20T or $318,000 per person. The next 30% made about $5T or $50,000 per person. The bottom 50% made about $1T or $6,000 per person. The resulting inflation is at a 40yr high and Powell wants the money back. Let’s recap what happened in the last 2 to 3 years. In addition to the Fed providing liquidity during the pandemic, there was a coordinated effort between the Monetary Authority and the Government where the Monetary Authority funded approximately $6T in fiscal stimulus between March 2020 and April 2021. The CARES Act ($2.3T), the CAA-21 ($900B) and the American Rescue Plan ($1.9T) were the 3 main pieces of legislation or appropriation in addition to several supplemental add-ons. What happened to the “new” money? Much of it went into the financial system as checkable deposits, $4T. This is an unprecedented increase in M1. |
|
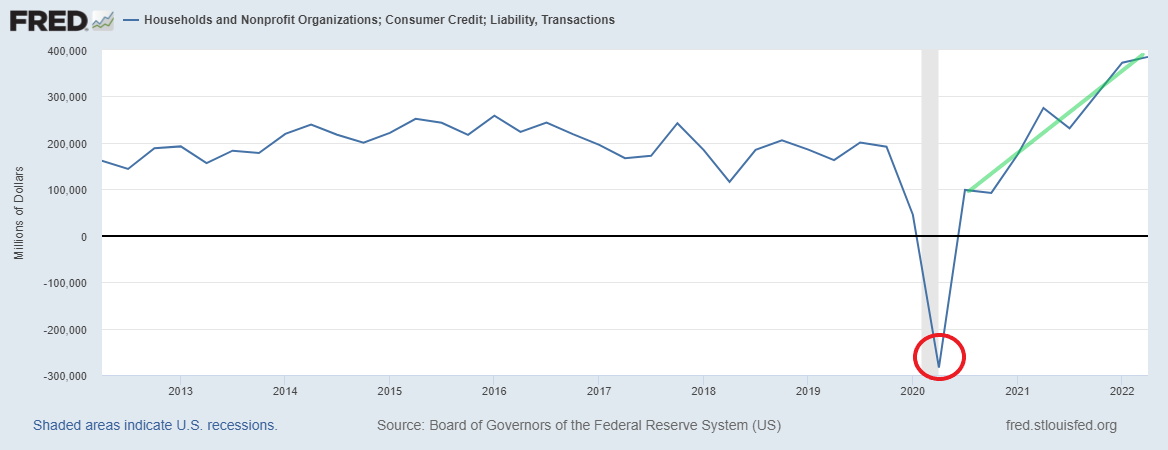
| Initially people paid down debt, about $300B in Q1 2020. But as the economy re-opened, they began to spend.. and borrow to spend. The graph below show quarterly consumer credit liability transaction, the amount of consumer debt added quarterly by the household and nonprofit sector. By Q2 2022, we were adding consumer debt at a clip of close to $400B per quarter or about 2x the average of the last decade. | |
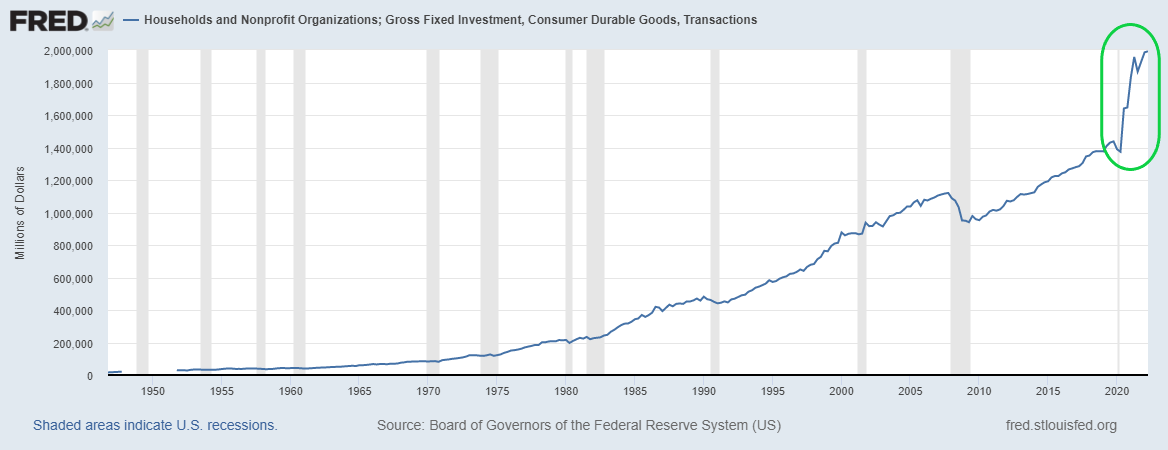
| What did we buy? Well mostly consumer durables as people renovated houses they just bought or houses newly purchased homes or current residences where they were spending more of their time. In a good year, consumer durables would add about $200B to GDP. In 2021, consumer durables added $1.5T. In the middle of a pandemic, from mid 2020 to mid 2022, we spent about $15T on fixed investment in consumer durables. This was a $3T or a 25% increase over the previous 2 year period. The government allocated roughly $6T in emergency funds and we increased spending on new appliances, outdoor living spaces, and renovated home offices by $3T? (see below) Other areas of spending growth to note are the automobile dealers, gasoline stations, bars/restaurants and nonstore retailers (door dash?). | |
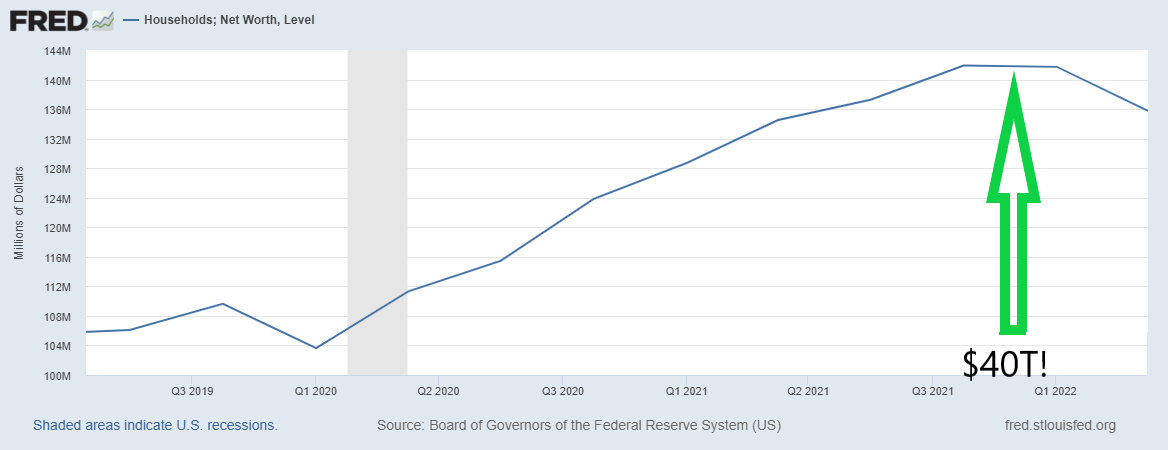
| The spending is significant. More significant is that the money gets spent once on food or extinguishing debt, but it remains in the financial system. After the first churn, the distortions become magnified as the new money is now available for leverage/re-hypothecation and the interest rate is 0. The abundance of cheap money causes inflation. The inflation is in the prices of both goods and assets. Where the money goes first and all the cause/effect dynamics can be debated. But what happened was the following. We had a 40% surge in money supply, about $6T. The multiplier effect produced balance sheet wealth for households of roughly $40T or 6.5x the base money added to the system from pandemic stimulus. Btw, we had asset growth with no offsetting liabilities, so this flowed directly to Net Worth. | |
| Here’s the break down of the $40T paper wealth created by asset inflation: $20T stock market, $8T home equity and the balance in small business/private equity, pensions and other assets (cash and bonds).
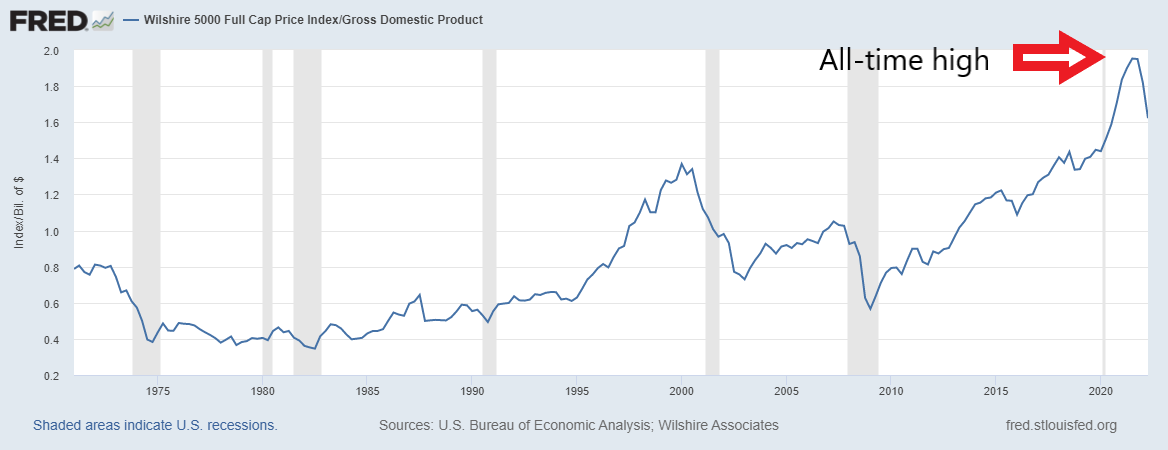
We can see the extreme valuations in equities (Buffet indicator) and the resulting wealth affect in household balance sheets. What does asset inflation look like for segments of the population? The top 1% of the US made about $14T or $4.2M per person. The next 19% made about $20T or $318,000 per person. The next 30% made about $5T or $50,000 per person. The bottom 50% made about $1T or $6,000 per person. |
|
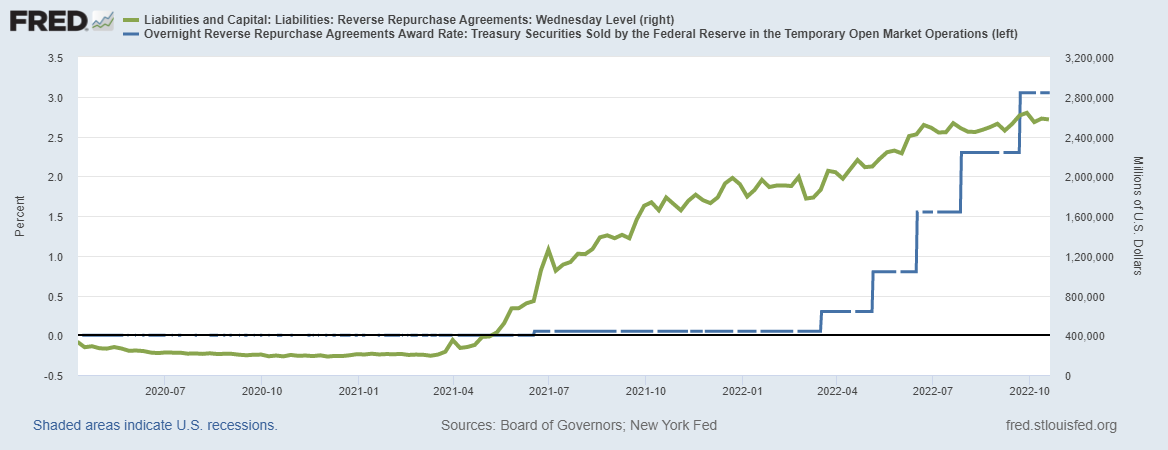
Headline: Cost of living inflation is now at 40 year highs, citizens are not happy, politicians are posturing and Powell wants the money back.Step 1: Neutralize the Money The process to do this is to pay more than the competitor for these funds. Rate hikes have been the headline, but the open market operations the Fed is utilizing in the short to medium term is the Reverse Repos. The Fed is essentially lending it’s balance sheet securities in exchange for cash and paying to do so. |
The Fed sells a Treasury with the promise to buy it back at a later date. In the short term, this ties up bank capital and raises the cost or crowds out potential borrowers in the real economy. This also lowers asset prices, arguably the source of the inflation. This is not without costs.
Powell’s Epiphany: Paying 4.5-5% to neutralize let’s say $4T dollars is expensive. Using Reverse Repos to neutralize the money is inflationary in itself. The Fed will be paying into the system roughly $200B on an annual basis to sequester this inflationary fuel. If removal of $4T is the goal, they are about 2/3 the way there.
Epiphany part 3: The Fed still hasn’t taken anything out of the system…thus “higher for longer.”
Tags: economy,Featured,Federal Reserve/Monetary Policy,newsletter,Taxes/Fiscal Policy

