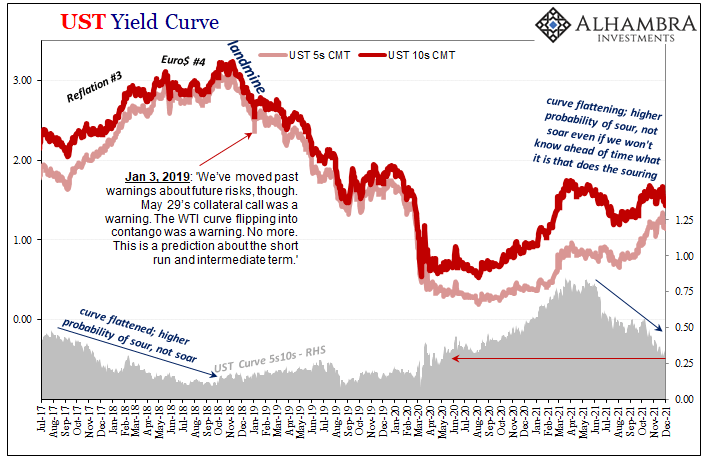
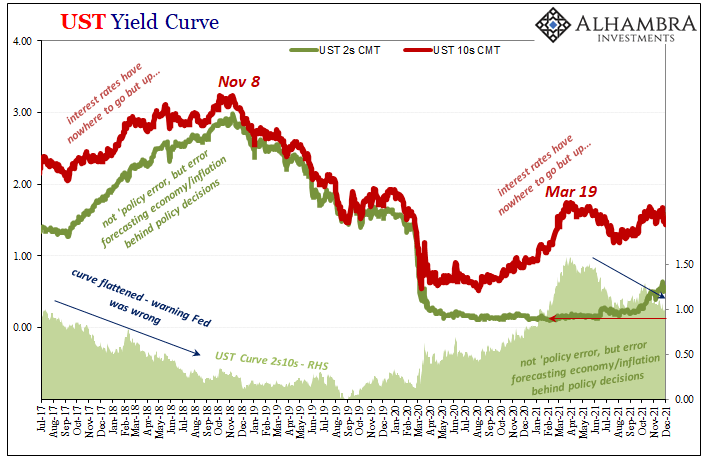
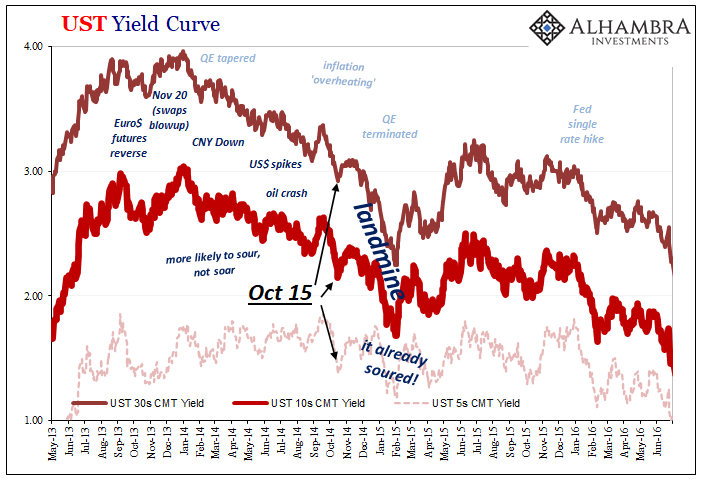
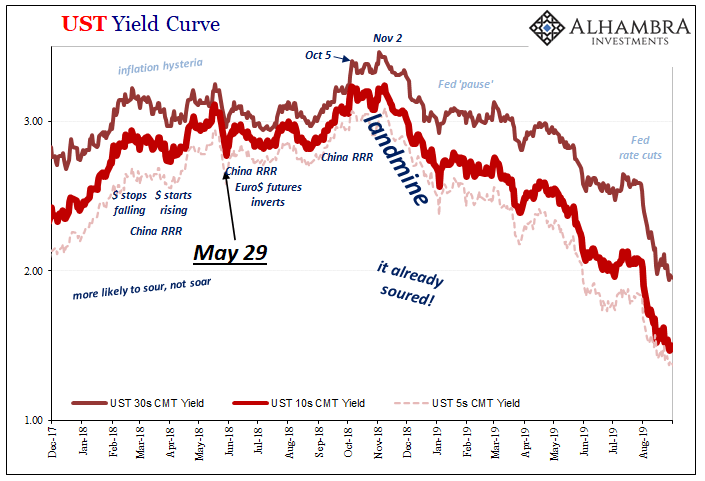
Stop me if you’ve heard this before: dollar up for reasons no one can explain; yield curve flattening dramatically resisting the BOND ROUT!!! everyone has said is inevitable; a very hawkish Fed increasingly certain about inflation risks; then, the eurodollar curve inverts which blasts Jay Powell’s dreamland in favor of the proper interpretation, deflation, of those first two. Twenty-eighteen, right? Yes. And also today. Quirky and kinky, it doesn’t seem like a lot, at least not at first. Just like three years ago, the inversion right now is but a basis point, inching toward one and a half at times intraday. And this upside-down piece of the curve is halfway down the thing; but that’s also how it started back in 2018, too. Before getting to what’s happening right
Topics:
Jeffrey P. Snider considers the following as important: 3-month libor, 5.) Alhambra Investments, bonds, currencies, Deflation, economy, eurodollar futures, eurodollar futures curve, Featured, Federal Reserve/Monetary Policy, FOMC, inflation, Interest rates, inversion, inverted curve, Markets, newsletter, rate hikes, taper, U.S. Treasuries, Yield Curve
This could be interesting, too:
Nachrichten Ticker - www.finanzen.ch writes Die Performance der Kryptowährungen in KW 9: Das hat sich bei Bitcoin, Ether & Co. getan
Nachrichten Ticker - www.finanzen.ch writes Wer verbirgt sich hinter der Ethereum-Technologie?
Martin Hartmann writes Eine Analyse nach den Lehren von Milton Friedman
Marc Chandler writes March 2025 Monthly
Stop me if you’ve heard this before: dollar up for reasons no one can explain; yield curve flattening dramatically resisting the BOND ROUT!!! everyone has said is inevitable; a very hawkish Fed increasingly certain about inflation risks; then, the eurodollar curve inverts which blasts Jay Powell’s dreamland in favor of the proper interpretation, deflation, of those first two.
Twenty-eighteen, right? Yes. And also today.
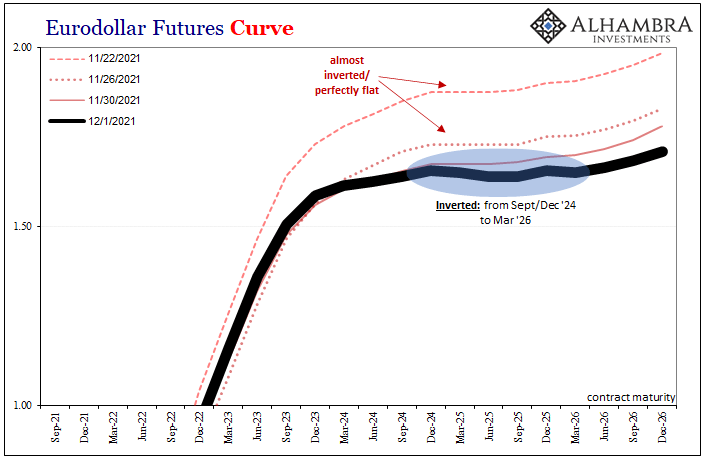
Quirky and kinky, it doesn’t seem like a lot, at least not at first. Just like three years ago, the inversion right now is but a basis point, inching toward one and a half at times intraday.
And this upside-down piece of the curve is halfway down the thing; but that’s also how it started back in 2018, too.
Before getting to what’s happening right now and what it means, we’re going to need some background first, a quick (sort of) review of that relevant history.
Unfortunately, whenever the subject of eurodollar futures comes up, whenever I write about them or Emil and I devote a show segment to their curve, quite a lot of people simply tune out. You can actually see how they start reading an article and then immediately click elsewhere once they realize this is what it’s about; or shut off our podcast episode as soon as the term “eurodollar futures” is first spoken – which is pretty frustrating and demoralizing given our show name and brand is, you know, Eurodollar University.
Believe me, I understand the reluctance. It is a complicated set of issues, and even as we make curves out of eurodollar futures contract prices, it isn’t immediately clear what they mean or even what they are made from (and why). For all that is about shadow money, eurodollar futures really can seem the most voodoo-like.
Yet, they are among the most important because these derivative contracts have been the most reliable especially early-warning indications that exist. Absent an actual monetary aggregate that takes into account enough of those shadows, something that not only does not exist, it probably can’t exist given our lack of true access, we have to let the system tell us what’s going on from the inside.
We only need to see the signals being beamed back in our direction from deep in the shadows, and then interpret them without the taint of the Fed Cult.
This is the other major hurdle to truly appreciating the message from eurodollar futures via the curve; its pricing, its very existence is pegged to 3-month LIBOR which is itself often closely associated with the Federal Reserve’s policy aims. On the surface, it seems like a market devoted to rating whatever the Fed wants in furtherance of the cult’s dogma.
Even worse, in one sense this is actually true. The front two “colors” (the whites and the reds) or eurodollar futures packs are – by and of technical necessity – largely bets (hedges) made on where the Fed has said it intends to set its policy targets (these days that’s a range for fed funds, with IOER and RRP rates used to corral fed funds and so highly influence, in theory, these other US$ markets including repo and unsecured eurodollars, therefore LIBOR).
In other words, the immediate front colors, those first two years in contract maturities, are likewise heavily influenced by whatever current Federal Reserve policy predictions. In 2018, that was the hawks and rate hikes. In 2021, taper first then the leading edge of rate hikes. Both cases, pricing the whites and reds, the front parts of the curve, mean pricing “hawkishness.”
Steep(er), upward sloping at the front.
After the reds, however, that is where it really gets interesting so it’s no accident this is where the most important developments keep coming up. Just like the US Treasury yield curve is a blending of different parts coming together in the middle, eurodollar futures, the curve’s back end is also more about perceived reality whether or not it matches up with the Fed’s aims and forecasts.
Further down the eurodollar curve, it’s not so much what the Fed says it will do but into the greens and blues (even golds) the market begins to discount current talk in favor of more independent assertions and perceptions about what the Fed will likely be able to do over time. As the long end of the yield curve, the longer end of eurodollar futures – even though still pegged to 3-month LIBOR – is more about future implications of current perceivable factors beyond strictly hawks, doves, or any bird in between.
Especially deflationary potential regardless of whether Jay Powell (like Bill Dudley) recognizes it.
In fact, going by history all the way back to late 2006 and Mr. Dudley, while the Fed/FOMC doesn’t recognize very real deflationary potential it gets priced into the eurodollar futures curve as intermediate inversion.
What do we mean by inversion?
Money like yield curves are supposed to be upward sloping, which means that the price of the next eurodollar futures in line is below (higher interest rates into the future) the one before it. This is the bias toward growth and inflation that a generally healthy economic/financial/monetary system produces, one where risks are tilted toward higher rates.
Higher rates, unlike what you’ve probably been taught, is a good thing, and this is a perfect example of it.
In the case of the post-2008 world, this is, or should be, doubly true given that rates are unnaturally low (not because of the Fed, but because what the interest rate fallacy tells us about what the Fed doesn’t do – money). The eurodollar futures curve should be more than upward sloping, especially steep should the market perceive a realistic pathway toward economic/financial/monetary normalcy.
Up is good; higher, more normal interest rates would indicate realistic (more than imagined) recovery potential.
Inversion, therefore, is when some or even much of the curve (see: post-landmine 2019) is downward sloping.
| Generally speaking, this is the market looking ahead and trading on expectations for relatively lower 3-month LIBOR. Nothing good is associated with an inverted curve: putting it in very simple terms, if the market begins to price where the Fed is more likely to cut rates rather than raise them, what does that tell us about what the market is perceiving as the balance of likely future risks?
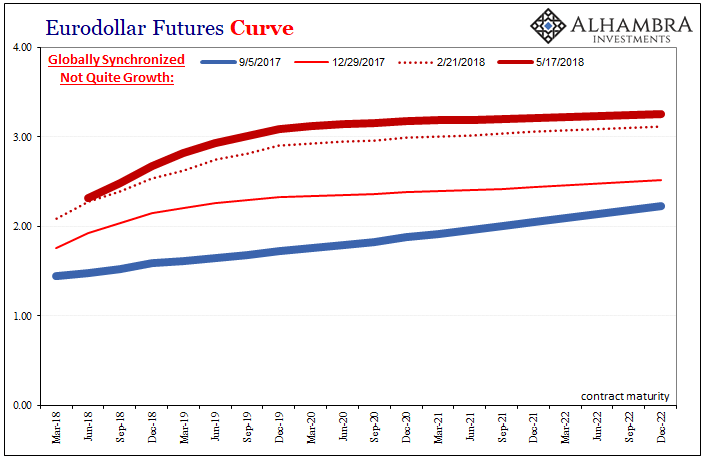
At first, these beliefs clash and balance right around where the reds and greens meet; that 2-year window down the curve. The reds are still heavily influenced by what Jay Powell says he’s going to do; the greens more and more inclined by what the market sees he’ll actually have to do – and more times than not, this means what he doesn’t want to or think he’ll do (2007-09; 2019). So, let’s go back to 2018, beginning in 2017 to review curve interpretations and calibrate our predictions (to be clear, we aren’t using the benefit of hindsight here; I wrote about that prior eurodollar futures curve inversion in real-time as it was unfolding, using its distortions and twists to make predictions which turned out to be highly useful and pretty quickly validated). From the starting point between September 2017 and February 2018, globally synchronized growth and inflation hysteria ruled practically unchallenged by any mainstream source. Upward, relatively steep curve. |
|
| However, the yield curve (USTs) really started to flatten out from there and then the dollar spiked (remember Dr. Patel: “dollar funding has evaporated” in early June 2018) against the otherwise Yellen-followed-by-Powell hawkish confidence in their optimistic forecasts. In eurodollar futures, the whites and reds, the front few years of contracts, reflected that optimism while increasingly the middle and back – greens, blues, and golds – started to trade against it consistent with the dollar, yield curve, and others.
Steeper up front, but then flatter out toward the end with those two opposing technical viewpoints meeting around the 2020 contracts; the red-green boundary. Inversion begins slowly, first dead flat before just a tiny little upside-down blip because it takes some substantial worry just to push this huge, sophisticated market out of its natural upward-sloping curve shape. |
|
| Enter May 29.
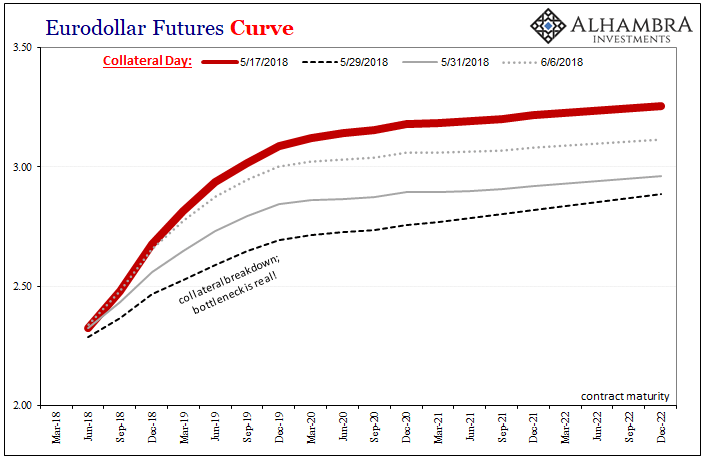
As things really started to go haywire, mid-May 2018 concern became that full-on collateral day (May 29). Huge break in the Treasury market (as in, buying panic consistent with collateral scarcity becoming outright shortage confirming fears of a bottleneck), reflected by sustained bids in eurodollar futures, each as an enormous increase in recognized deflation potential. |
|
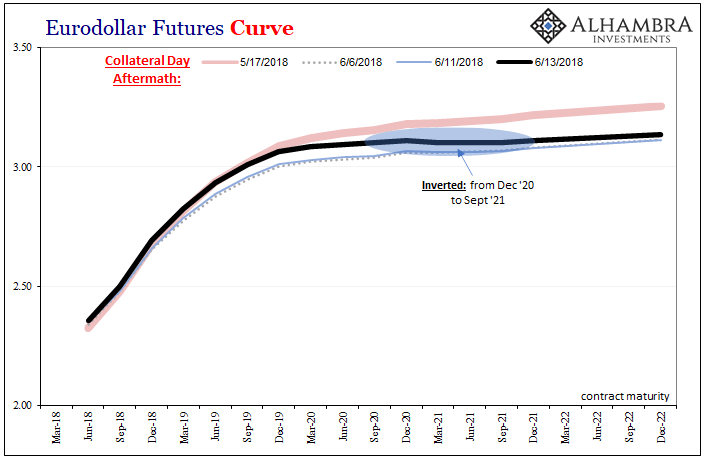
| Over the following few weeks, things appeared to settle down after the 29th but the curve around the red-green boundary, those 2020’s, it began to break down in a very big way.On June 13, 2018, the FOMC wrapped up its regular two-day policy meeting from which policymakers doubled-down on their inflation bias, issuing the ridiculous and contrary “symmetrical” inflation policy nonsense even though shadow markets were on deflationary fire.
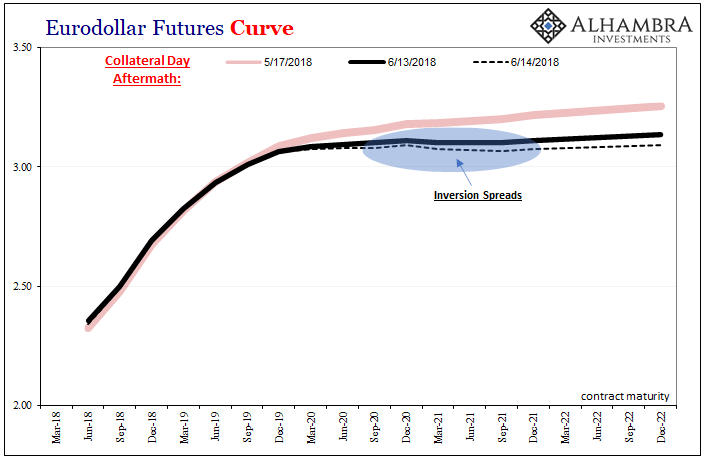
Rather than address, or even recognize, what was right then actual monetary problems, the FOMC yet again showed themselves of no worthwhile account – to which, money and financial markets forced yet again to take account of no help from these empty suits. The eurodollar futures market immediately broke down into that very tiny inversion in the greens (shown above). The following day, June 14, the inversion got a little bigger while expanding across more of the colors (shown below), into the blues as well as greens…and that was it for inflation (more importantly, recovery). Done. Kaput. |
|
| Inflation was in reality gone as any realistic possibility by mid-June 2018 even as for half a year more the Fed kept hiking rates and the media kept up its hysterical inflation projections, even though in reality by then they had come undone, completely unraveled once the entire monetary system itself, as we know from eurodollar futures, bet more and more against them.
To the point that this curve (and eventually others) was so distorted it broke upside-down. Several years later, twenty twenty-one, the year of massive inflation and an economy so red hot Warren Buffett announced his grandfatherly alarms to a consumer price wary public. Vaccines plus Uncle Sam had, he and many others declared, overdid it. That along with supply issues would lead to, they all said, massive seventies-style inflation for years to come. And a LABOR SHORTAGE!!!, too (also very 2018-like). Initially, the “bond market”, which includes the Treasury yield curve along with the eurodollar futures curve, at least agreed in part. |
|
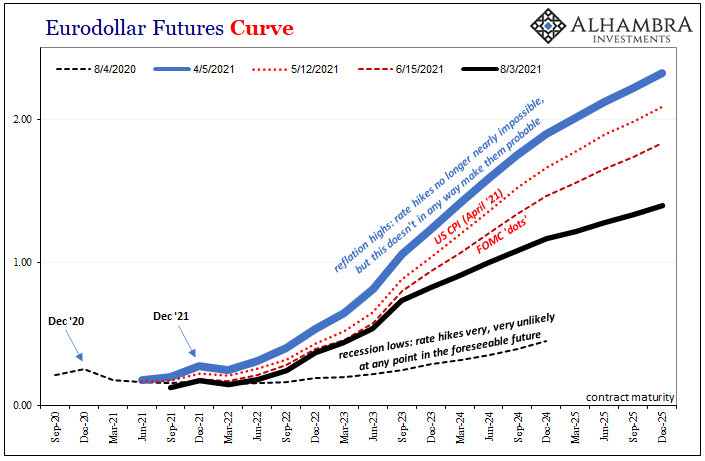
| There was modest reflation priced into moderately steeper curves reminiscent of globally synchronized growth 2017 into 2018 (though, it needs to be pointed out, in 2021 the curves never even got close to that far). |
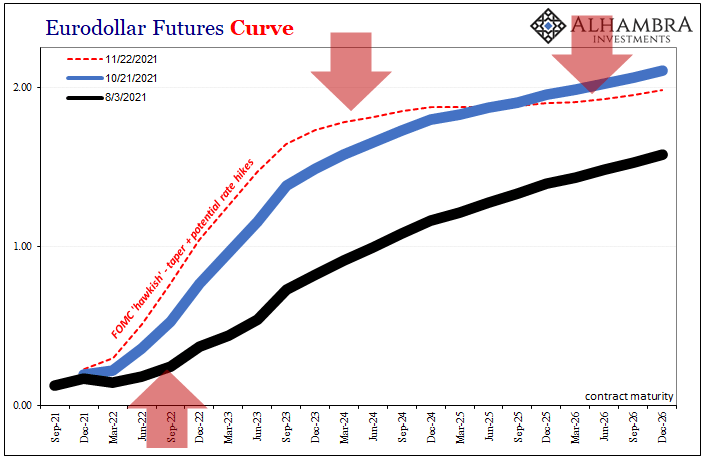 . |
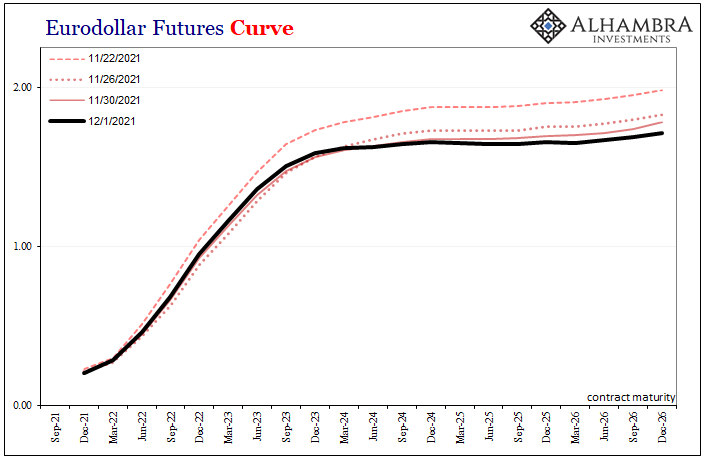
| Since early April, however, the market has gone back and forth on reflation potential; sinking to its recent lowest point in early August. After, the whites and reds have priced in taper and rate hikes (hawkish Fed policy claims) as they always do, steepening up front, but growing skepticism greens, blues, and golds – flattening from late 2023’s and really 2024’s out (shown above), especially over the past five or six weeks (shown below).
Neither omicron nor growth scare, growing questions about demand, collateral, and everything else deflationary – including what possible overreactions to pandemic potential would add to these already serious negative pressures. |
|
| This rebalancing of risks in the greens and blues, the 2024’s, continued throughout November before last week’s omicron. Finally, today: | |
| No one wants to hear this because CPIs are through the roof and eurodollar futures is hardly anyone’s favorite topic, yet here it is. This dependable, time-tested market pricing up from the actual shadow money system has sent up its signal whether anyone gets it or not. It’s here.
Inversion. As we’ve been saying all year, it has been deflationary potential in money which has dominated 2021’s landscape. One after another after another warning signs have been met, and now we have a pretty big one staring at us as this year draws toward its thoroughly disappointing close. |
|
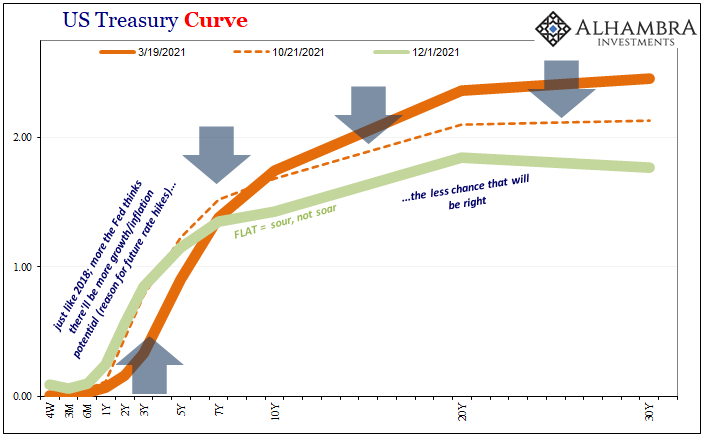
| But, as noted of the yield curve’s dramatic flattening, this inversion is no isolated case; thorough, unambiguous and complementary signals that are thoroughly corroborated in all manner of market prices, curves, and data (especially TIC).
What this inversion tells us on top of all those is that another big step has been taken – in the wrong direction toward deflationary conditions. As I noted at the time back in 2018, so many times, it takes a lot for these curves to get twisted upside-down. Flat curves may not be fully normal, but they are at least in the zip code. |
|
| Inverted is a different animal entirely, a next-level shift therefore a key signal how some threshold for “bad” has been reached in shadow money and perceptions about near-future shadow money.
Now, this doesn’t mean a crash or something else awful is being set up for Christmas-time; in 2018, it took several months even for the landmine to show up, and half a year more before Powell’s inverted curve-predicted rate cuts took place. There’s more work to do to decipher this clearly serious level of deflation potential as well as any possibly condensed pace for it. Still, this development is hardly surprising. It’s been coming all year, ever since, oh, around Fedwire. This wasn’t clickbait, it really was a really big one. |
Tags: 3-month libor,Bonds,currencies,Deflation,economy,eurodollar futures,eurodollar futures curve,Featured,Federal Reserve/Monetary Policy,FOMC,inflation,Interest rates,inversion,inverted curve,Markets,newsletter,rate hikes,taper,U.S. Treasuries,Yield Curve

