Pater Tenebrarum
My articles My siteAbout meMy booksMy videos
Follow on:TwitterFacebook
Seeking Alpha
Traders and Analysts Caught Wrong-Footed Over the past week gold and gold stocks have been on a tear. It is probably fair to say that most market participants were surprised by this development. Although sentiment on gold was not extremely bearish and several observers expected a bounce, to our knowledge no-one expected this: Back in April the so-called “managed money” category in the disaggregated commitments of traders report went net short gold futures for only the fourth time since 2007 (i.e., since disaggregated reporting was introduced). The recent peak in the net short position of this group of traders was 34,000 contracts and was reached on April 23 with gold trading at ,273. Since then these traders have
Topics:
Pater Tenebrarum considers the following as important: 6) Gold and Austrian Economics, 6b) Austrian Economics, Chart Update, Featured, newsletter, Precious Metals
This could be interesting, too:
Nachrichten Ticker - www.finanzen.ch writes Die Performance der Kryptowährungen in KW 9: Das hat sich bei Bitcoin, Ether & Co. getan
Nachrichten Ticker - www.finanzen.ch writes Wer verbirgt sich hinter der Ethereum-Technologie?
Martin Hartmann writes Eine Analyse nach den Lehren von Milton Friedman
Marc Chandler writes March 2025 Monthly
Traders and Analysts Caught Wrong-FootedOver the past week gold and gold stocks have been on a tear. It is probably fair to say that most market participants were surprised by this development. Although sentiment on gold was not extremely bearish and several observers expected a bounce, to our knowledge no-one expected this: Back in April the so-called “managed money” category in the disaggregated commitments of traders report went net short gold futures for only the fourth time since 2007 (i.e., since disaggregated reporting was introduced). The recent peak in the net short position of this group of traders was 34,000 contracts and was reached on April 23 with gold trading at $1,273. Since then these traders have switched back to a modest net long position of around 26,000 contracts (the historic peak in the managed money net long position was almost 270,000 contracts). The change in opinion reflected by this shift in speculator positioning is actually in line with the fundamental backdrop for gold, which has turned more bullish. It is also worth noting that the producer/merchant category of traders was net short by just 36,000 contracts on April 23. Since then the net short position of this group has grown to around 61,000 contracts – which is still a historically low level. The last time producers held such a small net short position was in December 2015. Speculators have probably added quite a bit to their long positions in the recent rally and the market is obviously short term overbought. That said, such rapid and large moves have historically often evolved into medium to long term advances – even if they were initially followed by a pullback. |
Gold stocks (HUI Index) and gold, daily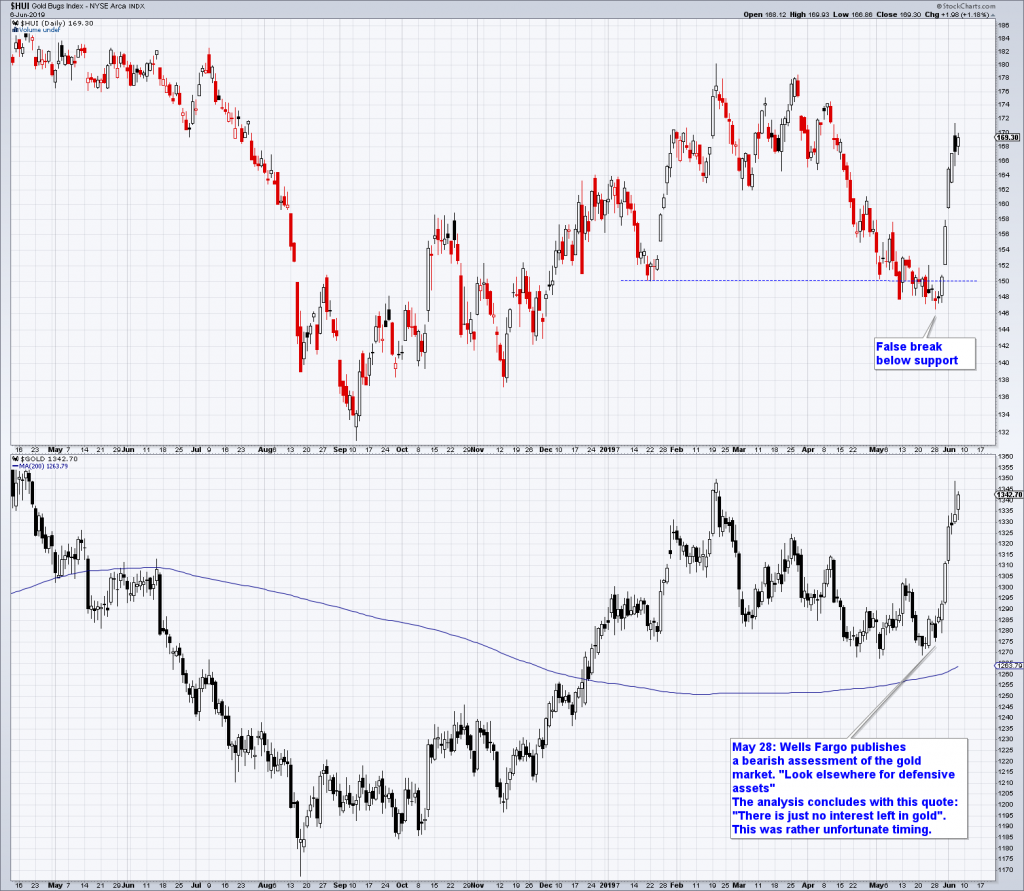 As noted in the annotation above, a Wells Fargo gold analyst turned bearish at the worst possible moment – exactly one day before gold took off like a scalded cat. We mention this mainly because it demonstrates that markets often defy widespread expectations. - Click to enlarge |
Gold Strong in Terms of Foreign CurrenciesWe always keep an eye on South African gold stocks because they often lead their US and Canadian brethren. This time they have only led by a few days, but it is worth noting that the rally was quite vigorous, with the FTSE/JSE gold index ending at a new high for the move. |
JSE All Golds Index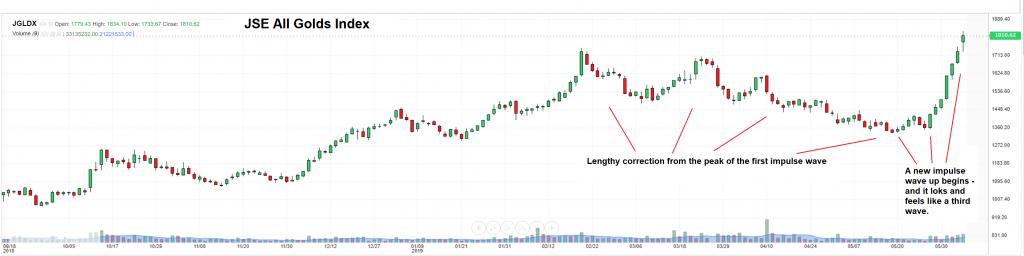 A very strong rally in the FTSE/JSE gold index. - Click to enlarge |
| Gold itself is actually close to a breaking out to a new all time high in Rand terms: |
Gold in Rand, weekly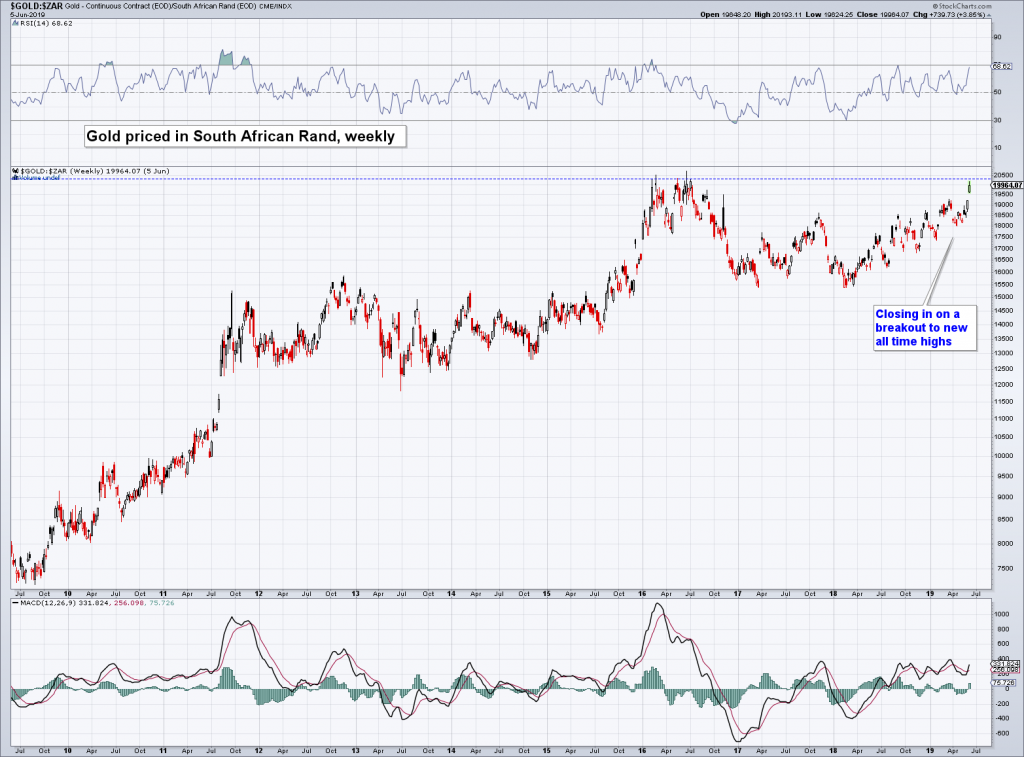 The Rand gold price is closing in on a new all time high. - Click to enlarge |
| Australia is another major gold producing region – and gold in terms of the Australian dollar has in fact already moved into new all time high territory:
While gold remains a long way from its 2011 peak in US dollar terms, it looks very strong in practically every non-US dollar currency – including other developed market currencies like the euro and the yen. In other words, the gold price is exhibiting strength despite a strong US dollar. Per experience this phenomenon is associated with the early stages of new bull markets. This is because gold tends to discount future rate cuts by the Fed long before they are actually implemented – while the dollar’s response is traditionally more sluggish. A roughly similar set-up was for instance seen in 2000-2001. In the second half of 2000 gold began to strengthen somewhat despite a still rising US dollar, while gold stocks remained comparatively weak and initially continued to decline. This relative underperformance of gold stocks also typically occurs ahead of medium to long term trend changes. However, once gold stocks do start to move up, they usually outperform the metal (we have discussed how to recognize the early stages of bull markets in the sector in late 2015). |
Gold in Australian dollars, weekly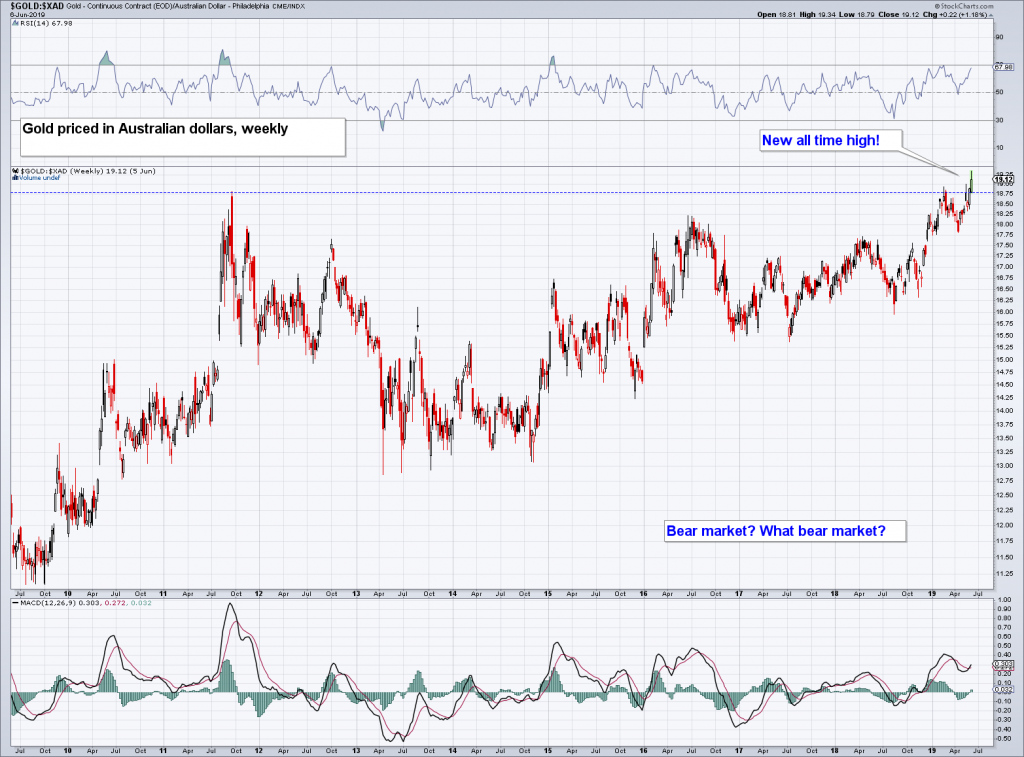 Gold has recently reached a new all time high in terms of this currency. - Click to enlarge |
Conclusion – Keep Your Eyes PeeledA pullback to relieve overbought conditions is probably soon in the cards, not least because the stock market has begun to recover again. But the recent strong move in the gold sector is at the very least a heads-up: it suggests that it will probably be worth paying close attention from here on out. Seasonally gold tends to be weak in the summer months – the annual seasonal low is typically made in mid June, followed by a secondary low in August. However, it is definitely possible that the seasonal low has simply arrived a little earlier this year. Although gold normally struggles during the summer months, there exist several historical examples of summer rallies as well, which happened in the context of long term bull markets (particularly vigorous summer rallies were e.g. seen in 1977 and 1978). Lastly, there is obviously strong resistance in the $1,360 to $1,375 region, which gold has been unable to overcome in several attempts since the early 2016 advance. It seems to us that the chance of finally breaking through this resistance level is much better this time than previously. For one thing, the rally has started from a higher low and for another thing, the fundamental backdrop is more gold-friendly at the moment than it was on occasion of the previous break-out attempts. If it does finally happen, it is probably not going to happen right away, but an eventual breakout over this resistance level would definitely be quite meaningful from a technical perspective. |
Gold, 30-year seasonal chart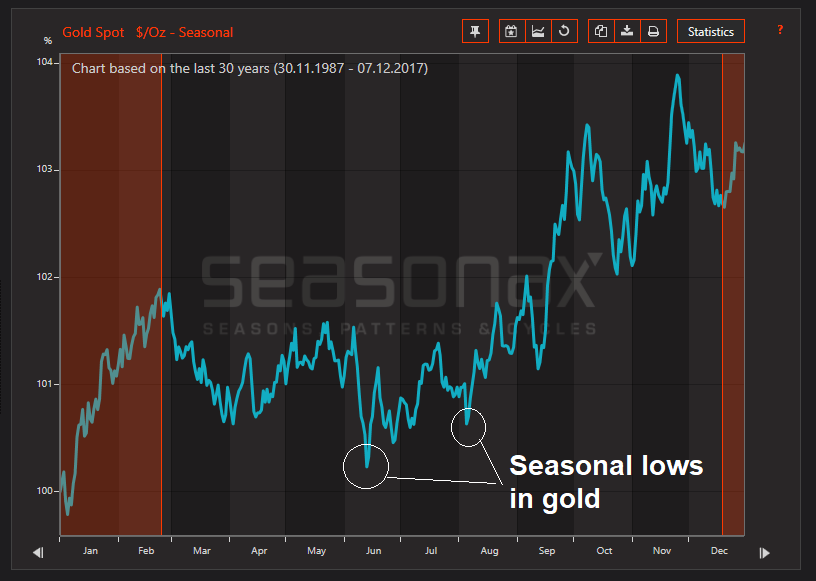 Typically lows are established in mid June and early August, but there have been exceptions to this rule. - Click to enlarge |
Charts by: StockCharts, investing.com, Seasonax
Tags: Chart Update,Featured,newsletter,Precious Metals