Summary:
The cold truth is homelessness and soaring rents are the only possible outputs of central bank policies that inflate asset bubbles. It’s been a long, strange economic boom since the nadir of the Global Financial Meltdown in 2009. A 10-year long boom that saw the S&P 500 rise from 666 in early 2009 to 2,780 and GDP rise by 43% has been slightly more uneven for most participants. First and most importantly, household income hasn’t risen by the same percentages as assets, GDP or costs of big-ticket expenses such as rent, healthcare and college tuition. The broadest measure of income, median household income, has registered a 23% increase in the past decade, roughly half of GDP gains and a mere fraction of stock market
Topics:
Charles Hugh Smith considers the following as important: 5) Global Macro, Featured, newsletter, The United States
This could be interesting, too:
Nachrichten Ticker - www.finanzen.ch writes Die Performance der Kryptowährungen in KW 9: Das hat sich bei Bitcoin, Ether & Co. getan
Nachrichten Ticker - www.finanzen.ch writes Wer verbirgt sich hinter der Ethereum-Technologie?
Martin Hartmann writes Eine Analyse nach den Lehren von Milton Friedman
Marc Chandler writes March 2025 Monthly
The cold truth is homelessness and soaring rents are the only possible outputs of central bank policies that inflate asset bubbles.
It’s been a long, strange economic boom since the nadir of the Global Financial Meltdown in 2009. A 10-year long boom that saw the S&P 500 rise from 666 in early 2009 to 2,780 and GDP rise by 43% has been slightly more uneven for most participants.
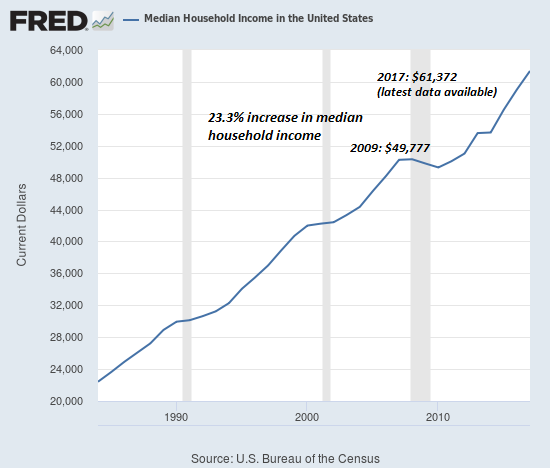
First and most importantly, household income hasn’t risen by the same percentages as assets, GDP or costs of big-ticket expenses such as rent, healthcare and college tuition. The broadest measure of income, median household income, has registered a 23% increase in the past decade, roughly half of GDP gains and a mere fraction of stock market and housing gains.
It’s well known income gains have skewed to the top, as revealed by Census Bureau data: Historical Income Tables: Household (US Census Bureau).
The bottom quintile (20%) registered income gains of 20% from 2009 to 2017, while the middle quintile (roughly speaking, the middle class) gained 25.5% and the top 5% enjoyed a 31.6% gain.
The raw numbers tell the story in a slightly more visceral fashion:
Upper limit of bottom quintile: $24,638 up 20% since 2009
Upper limit of middle quintile: $77,552 up 25.5% since 2009
Lower limit of top 5%: $237,034 up 31.6% since 2009
(the median household income is much higher–around $350,000 according to Household Income Quintiles the Tax Policy Center.)
(the median household income is much higher–around $350,000 according to Household Income Quintiles the Tax Policy Center.)
So the top 5% earn at a minimum 10 times the lowest quintile income and around 4 or 5 times the middle quintile income.
Here in Northern California, this has manifested in rapidly expanding homeless encampments a stone’s throw away from new luxury rental apartments charging $3,000 and up for one-bedroom flats and $4,000 and up for two-bedroom flats.
Meanwhile, the streets are filled with potholes and cracks. Maintaining streets–presumably one of the core missions of local government–is simply not being done in a timely manner. Major streets are in such disrepair that local businesses have taken to raising banners demanding “pave our street now.”
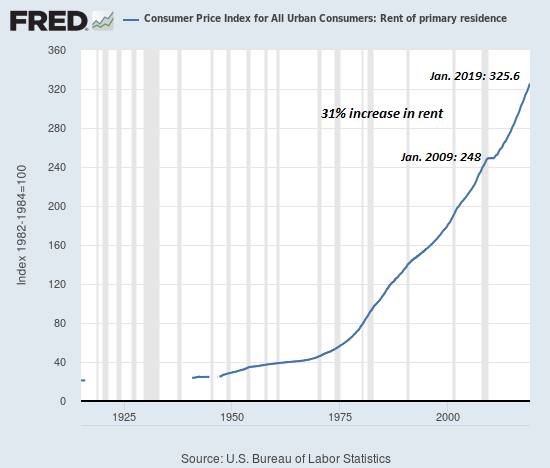
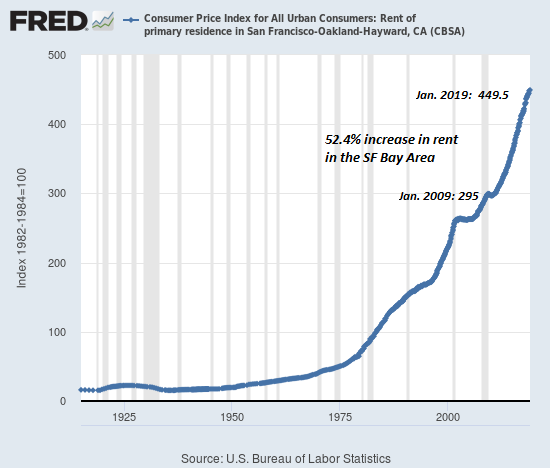
| Let’s look at three charts of the long, strange boom from 2009: median household income (up 23%), national rents (up 31%) and rent in the San Francisco Bay Area (up 52.4%). Rents are double the gains in median household income in many cities. |
US Median Household Income |
|
The tens of thousands of pricey rentals being built in the region assume an endless expansion of well-paid techie jobs filled by young techies who are happy to sacrifice all hope of ever owning a home in the region ($900,000 for a 100-year old bungalow on a 5,000 square foot lot) or having a family unless they cash in on an IPO or marry a techie who already cashed in.
Sadly, the affordable housing fees collected by cities (up to $10 million per project) are not enough to address the unprecedented need for affordable housing and low-cost housing solutions for the homeless and near-homeless.
|
US Rent of Primary Residence, 1925 - 2018(see more posts on U.S. Consumer Price Index, ) |
|
What’s behind the soaring cost of housing? It’s really pretty simple: the extended near-zero interest rates and unlimited liquidity pushed by the Federal Reserve as the “solution” for recession have impoverished the bottom 80% and put ownership of capital out of reach for all but the top 5%.
Though the mainstream media punditry and the political class will deny this, the cold truth is homelessness and soaring rents are the only possible outputs of central bank policies that inflate asset bubbles that inevitably outpace the wages needed to pay the soaring cost of rent and housing.
|
US Rent of Primary Residence in SF Bay Area, 1925 - 2018(see more posts on U.S. Consumer Price Index, ) |
My new book is The Adventures of the Consulting Philosopher: The Disappearance of Drake. For more, please visit the book's website.
Tags: Featured,newsletter


