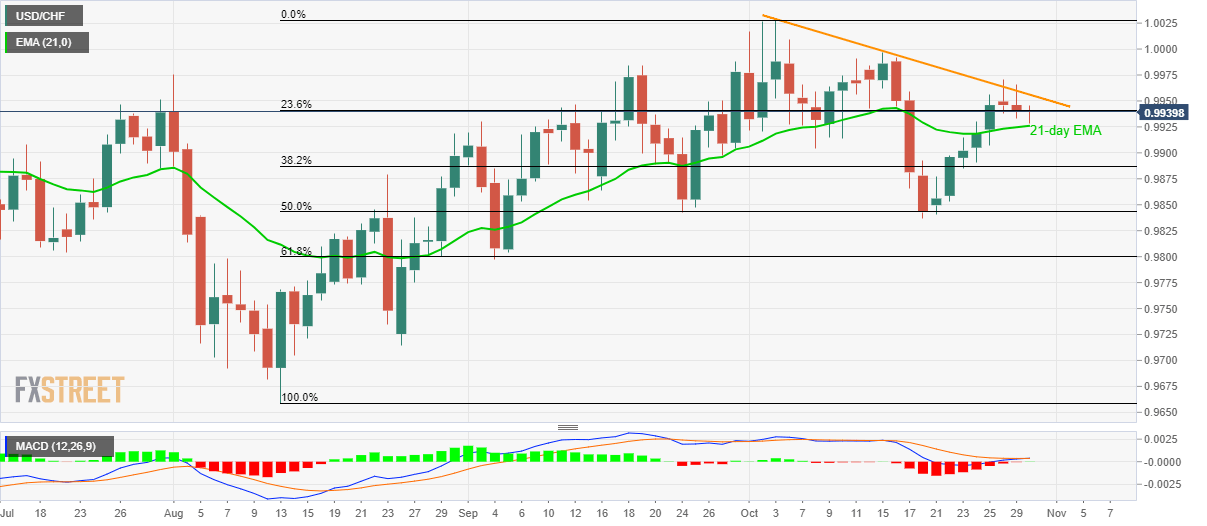
USD/CHF stays above 21-day EMA amid bullish MACD. A daily closing beyond the monthly trendline will trigger fresh upside. Given the monthly falling resistance line and 21-day EMA confusing USD/CHF traders on a key day, the quote seesaws near 0.9940 during pre-European session on Wednesday. Adding to the odds of pair’s run-up are bullish signals from the 12-bar Moving Average Convergence and Divergence (MACD) indicator. However, buyers need a sustained break above a descending trend line since October 03, at 0.9960, to take aim at 1.000 round-figure. Meanwhile, pair’s declines below 21-day Exponential Moving Average (EMA) highlights the importance of 38.2% and 50% Fibonacci retracement levels of August-October upside, at 0.9885 and 0.9845 respectively. Other than
Topics:
Anil Panchal considers the following as important: 1) SNB and CHF, 1.) FXStreet on SNB&CHF, Featured, newsletter, USD/CHF
This could be interesting, too:
RIA Team writes The Importance of Emergency Funds in Retirement Planning
Nachrichten Ticker - www.finanzen.ch writes Gesetzesvorschlag in Arizona: Wird Bitcoin bald zur Staatsreserve?
Nachrichten Ticker - www.finanzen.ch writes So bewegen sich Bitcoin & Co. heute
Nachrichten Ticker - www.finanzen.ch writes Aktueller Marktbericht zu Bitcoin & Co.
- USD/CHF stays above 21-day EMA amid bullish MACD.
- A daily closing beyond the monthly trendline will trigger fresh upside.
| Given the monthly falling resistance line and 21-day EMA confusing USD/CHF traders on a key day, the quote seesaws near 0.9940 during pre-European session on Wednesday.
Adding to the odds of pair’s run-up are bullish signals from the 12-bar Moving Average Convergence and Divergence (MACD) indicator. However, buyers need a sustained break above a descending trend line since October 03, at 0.9960, to take aim at 1.000 round-figure. Meanwhile, pair’s declines below 21-day Exponential Moving Average (EMA) highlights the importance of 38.2% and 50% Fibonacci retracement levels of August-October upside, at 0.9885 and 0.9845 respectively. Other than technical catalysts, traders will also be on the lookout for Swiss ZEW Expectations for October, forecast -6.8 versus -15.4, while the United States (US) Federal Reserve’s interest rate decision will also be the key to follow. |
USD/CHF daily chart, August-November 2019(see more posts on USD/CHF, ) |
Trend: sideways
Tags: Featured,newsletter,USD/CHF

