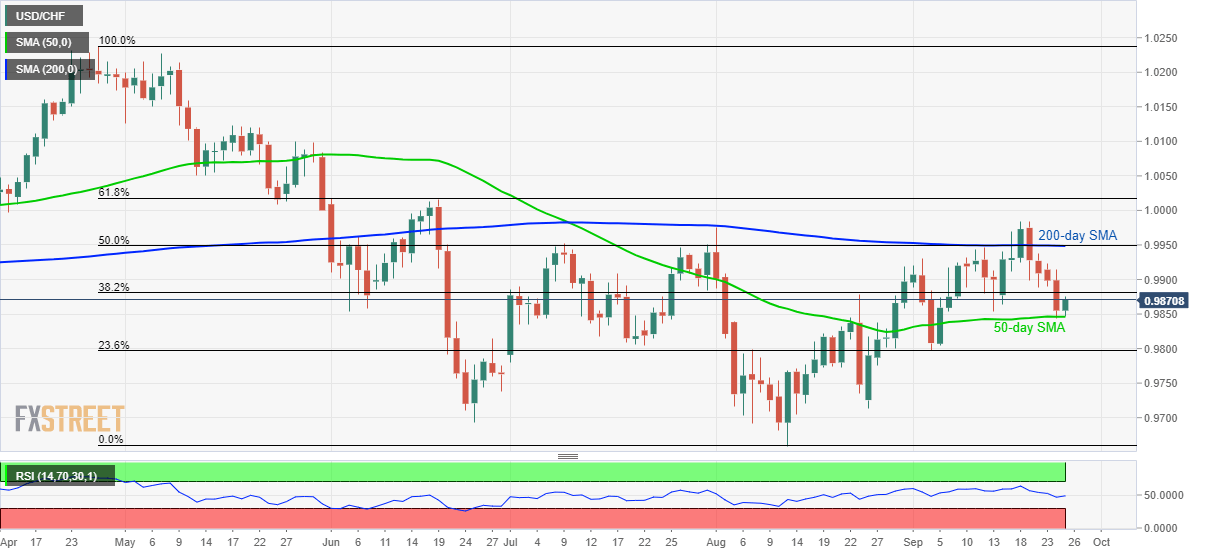
USD/CHF takes a U-turn towards 38.2% Fibonacci retracement, 0.9950 resistance confluence. Sustained break of 50-DMA can recall 0.9800 on the chart. September month Swiss ZEW Expectations and SNB’s Q3 Bulletin in the spotlight. With its recent recovery from the 50-day simple moving average (SMA), the USD/CHF pair takes the bids to 0.9875 while heading into the European session on Wednesday. 38.2% Fibonacci retracement level of April-August declines, at 0.9880, becomes the closest resistance ahead of 0.9900 and 0.9950 confluence region including 200-day SMA and 50% Fibonacci retracement. In a case where prices manage to close beyond 0.9950 on a daily closing basis, monthly high surrounding 0.9985 and 1.0000 could lure bulls before pushing them to 61.8% Fibonacci
Topics:
Anil Panchal considers the following as important: 1.) FXStreet on SNB&CHF, Featured, newsletter, USD/CHF
This could be interesting, too:
RIA Team writes The Importance of Emergency Funds in Retirement Planning
Nachrichten Ticker - www.finanzen.ch writes Gesetzesvorschlag in Arizona: Wird Bitcoin bald zur Staatsreserve?
Nachrichten Ticker - www.finanzen.ch writes So bewegen sich Bitcoin & Co. heute
Nachrichten Ticker - www.finanzen.ch writes Aktueller Marktbericht zu Bitcoin & Co.
- USD/CHF takes a U-turn towards 38.2% Fibonacci retracement, 0.9950 resistance confluence.
- Sustained break of 50-DMA can recall 0.9800 on the chart.
- September month Swiss ZEW Expectations and SNB’s Q3 Bulletin in the spotlight.
| With its recent recovery from the 50-day simple moving average (SMA), the USD/CHF pair takes the bids to 0.9875 while heading into the European session on Wednesday.
38.2% Fibonacci retracement level of April-August declines, at 0.9880, becomes the closest resistance ahead of 0.9900 and 0.9950 confluence region including 200-day SMA and 50% Fibonacci retracement. In a case where prices manage to close beyond 0.9950 on a daily closing basis, monthly high surrounding 0.9985 and 1.0000 could lure bulls before pushing them to 61.8% Fibonacci retracement level of 1.0016. Meanwhile, a downside break of 50-DMA can fetch the pair to 23.6% Fibonacci retracement close to 0.9800 whereas 0.9720 and 0.9700 may please sellers afterward. On the fundamental front, traders will take clues from the Swiss ZEW Expectations (prior -37.5) and third quarter (Q3) bulletin from the Swiss National Bank. Investors will seek clues of the SNB’s latest hawkish statements from the bulletin to strengthen the Swiss Franc (CHF). |
USD/CHF daily chart, April-October 2019(see more posts on USD/CHF, ) |
Trend: pullback expected
Tags: Featured,newsletter,USD/CHF

