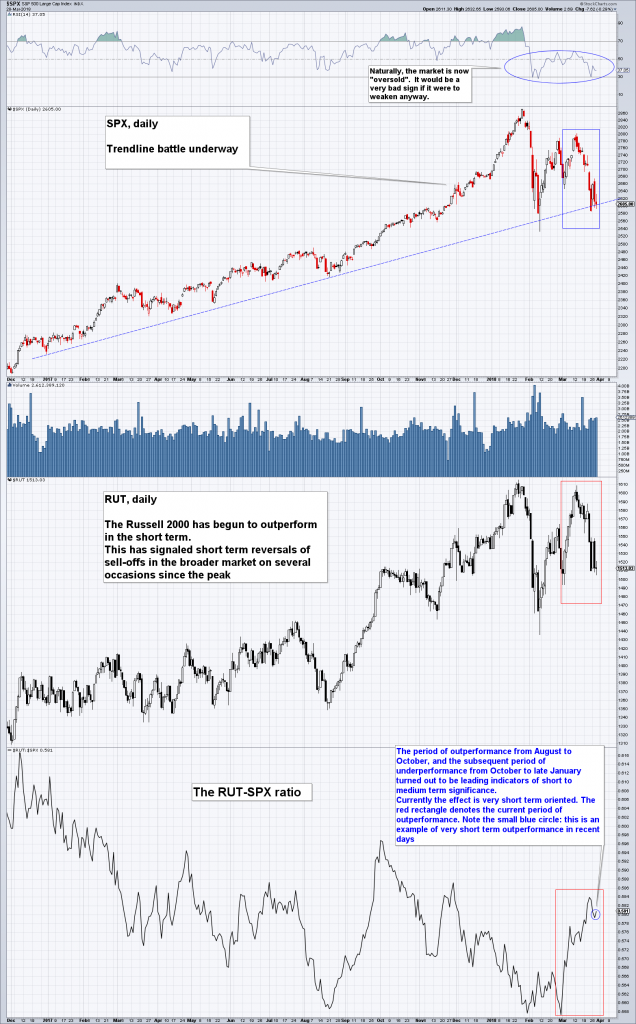
SPX Trendline Battle, Relative Strength in RUT We reviewed the daily charts after yesterday’s close and noticed that the Russell 2000 Index, the NYA and transportation stocks all exhibited relative strength (the same holds actually for the DJIA), particularly vs. the FANG/NDX group. This is happening just as the SPX is battling with an extremely important trendline. As we pointed out before, relative strength in the RUT in particular served as a short term reversal signal ever since the sell-off started in February. The question is if this signal will continue to work. Here is an updated chart: SPX Daily, RUT Daily and SPX-RUT Ratio, Dec 2016 - Mar 2018The SPX, the RUT and the RUT-SPX ratio. - Click to enlarge
Topics:
Pater Tenebrarum considers the following as important: Debt and the Fallacies of Paper Money, Featured, newsletter, The Stock Market
This could be interesting, too:
RIA Team writes The Importance of Emergency Funds in Retirement Planning
Nachrichten Ticker - www.finanzen.ch writes Gesetzesvorschlag in Arizona: Wird Bitcoin bald zur Staatsreserve?
Nachrichten Ticker - www.finanzen.ch writes So bewegen sich Bitcoin & Co. heute
Nachrichten Ticker - www.finanzen.ch writes Aktueller Marktbericht zu Bitcoin & Co.
SPX Trendline Battle, Relative Strength in RUTWe reviewed the daily charts after yesterday’s close and noticed that the Russell 2000 Index, the NYA and transportation stocks all exhibited relative strength (the same holds actually for the DJIA), particularly vs. the FANG/NDX group. This is happening just as the SPX is battling with an extremely important trendline. As we pointed out before, relative strength in the RUT in particular served as a short term reversal signal ever since the sell-off started in February. The question is if this signal will continue to work. Here is an updated chart: |
SPX Daily, RUT Daily and SPX-RUT Ratio, Dec 2016 - Mar 2018Relative strength in the Russell persists, and it has acted quite firm over the past several days in the face of growing weakness in the big cap tech sector. On previous occasions this has indicated an imminent short term upside reversal. At the same time, the SPX is sitting on the decisive trendline recently discussed by Dimitri Speck in connection with “crash analogs”. Interestingly, the Modified Ned Davis Method flipped to a 50% net short position on the Russell last Friday – will it be whipsawed again? |
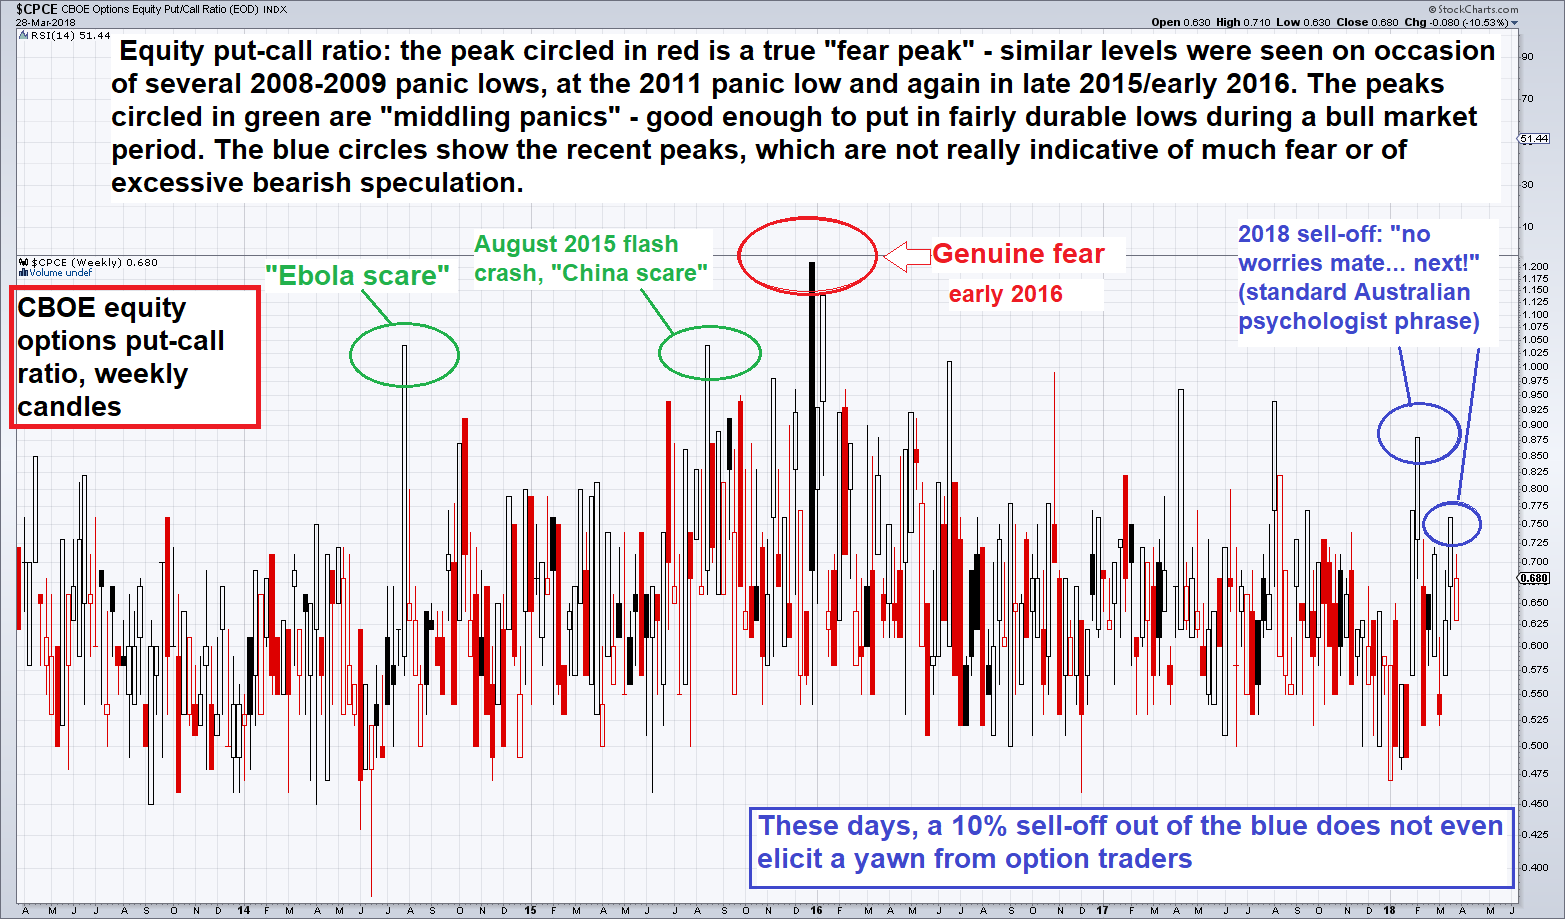
Market Psychology RevisitedWe also want to briefly show another short term signal, in this case a well-known sentiment/positioning measure, namely the equity put-call ratio. Below is a weekly chart (candlesticks) of the CBOE equity p/c ratio. This is quite interesting to us, as it confirms something we pointed out in yesterday’s “GBEB Death Watch” article: the recent sell-off has so far utterly failed to generate any fear. |
CBOE Options Equity Put/Call Ratio, Apr 2013 - Mar 2018 CBOE equity put-call ratio, weekly candles: “no worries mates!” – the peaks reached in the two selling squalls since early February came in at essentially meaningless levels. - Click to enlarge Even the tiny dips of 2017 generated more fear or invited more intense downside speculation. |
It appears traders are well-trained by now: there is nothing to fear, all downturns represent dip buying opportunities. As long as the trendline shown in the SPX chart above holds, they may well be right of course – and yet, this nonchalant response to one of the biggest selling waves of recent years is definitely out of character. And once again, we are mildly surprised how little attention such factoids seem to be getting these days.
Instead, a quite common refrain is this: “the economy is strong, therefore the stock market is safe”. Naturally, valuations do not rate a mention in these analyses, and admittedly valuations have not mattered for quite some time. Perhaps the little tidbits no-one seems to be looking at anymore will though.
Tags: Featured,newsletter,The Stock Market

