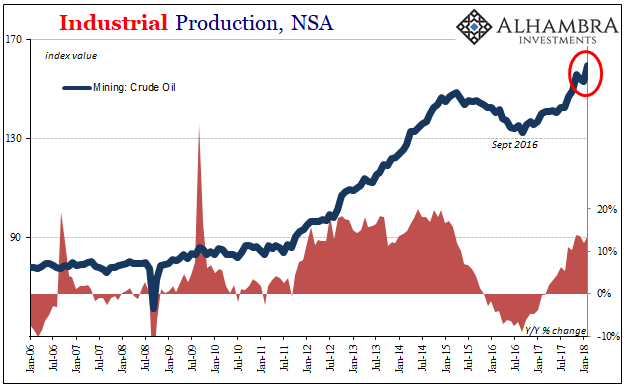
In February 2018, it was like old times for the US industrial sectors. Prior to the 2015-16 downturn, the otherwise moribund economy did produce two genuine booms. The first in the auto sector, the other in energy. Without them, who knows what the no-recovery recovery would have looked like. They were for the longest time the only bright spots. US Industrial Production, Jan 2006 - 2018(see more posts on U.S. Industrial Production, ) - Click to enlarge The oil sector has roared back on the flight of oil prices off the February 2016 lows. Even before the Federal Reserve’s latest estimates on Industrial Production, released today, we knew that the mining portion was on fire due to shale. The US EIA figures for
Topics:
Jeffrey P. Snider considers the following as important: consumer goods, currencies, economy, Energy, Featured, Federal Reserve/Monetary Policy, industrial production, manufacturing, Markets, Mining, Motor Vehicle Assemblies, newslettersent, Oil, shale, The United States, U.S. Industrial Production, U.S. Motor Vehicle Assemblies
This could be interesting, too:
RIA Team writes The Importance of Emergency Funds in Retirement Planning
Nachrichten Ticker - www.finanzen.ch writes Gesetzesvorschlag in Arizona: Wird Bitcoin bald zur Staatsreserve?
Nachrichten Ticker - www.finanzen.ch writes So bewegen sich Bitcoin & Co. heute
Nachrichten Ticker - www.finanzen.ch writes Aktueller Marktbericht zu Bitcoin & Co.
| In February 2018, it was like old times for the US industrial sectors. Prior to the 2015-16 downturn, the otherwise moribund economy did produce two genuine booms. The first in the auto sector, the other in energy. Without them, who knows what the no-recovery recovery would have looked like. They were for the longest time the only bright spots. |
US Industrial Production, Jan 2006 - 2018(see more posts on U.S. Industrial Production, ) |
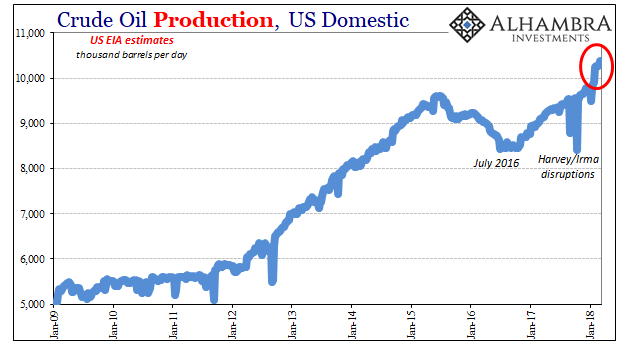
| The oil sector has roared back on the flight of oil prices off the February 2016 lows. Even before the Federal Reserve’s latest estimates on Industrial Production, released today, we knew that the mining portion was on fire due to shale. The US EIA figures for domestic oil production, for example, registered a massive increase in February (based on what isn’t clear; there was, evidently, some kind of stoppage or slowdown in crude production in January showing up in both data series). |
US Crude Oil Production, Jan 2009 - 2018 |
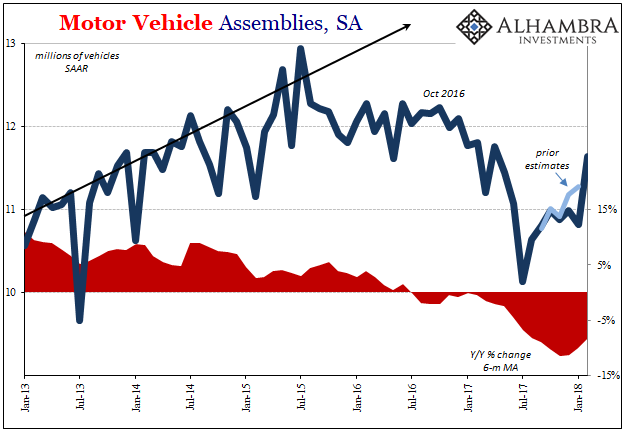
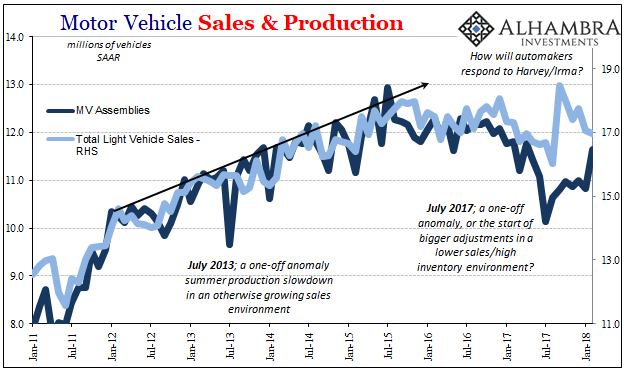
| The good fortune in mining was shared by auto production. After revising January’s estimates for Motor Vehicle Assemblies down by a significant amount, the Federal Reserve stats pushed domestic auto production in February up by a substantial amount for largely unknown reasons. Auto sales haven’t changed; in fact, after the hurricanes’ temporary destructive assist, vehicle purchases have dropped back down toward last summer’s weak levels. | |
| I’d really hate to say it’s weather, but in both sectors autos and energy it does appear as something like it. Lousy January sales were blamed on snow storms at the beginning of that month, and it’s possible given their Midwestern attention that production was scaled back a bit along with them – only to be ramped up in February to make up for lost time (I haven’t seen any reports, however, of plant outages in that timeframe).
It’s also possible that automakers dismissed January’s sales because of winter as well as it having been January.
The problem with that view, obviously, is that sales were slightly worse still in February. January wasn’t an anomaly, raising the question as to whether production last month was. MVA’s are also very noisy on a month-to-month basis, as you can see above particularly on the rise before the 2015 inflection. It will have to be sorted out in the coming months. |
Motor Vehicle Sales and Production, Jan 2011 - 2018 |
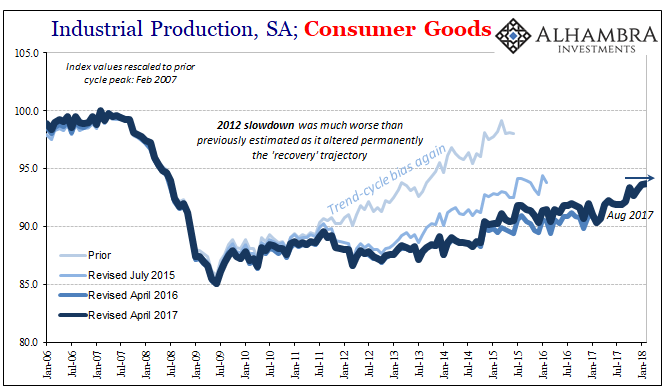
| Outside of autos and oil, US industry was a bit more subdued. Production of consumer goods, a less volatile proxy, has been flat since October. In this important segment, the hurricane effects were far less than exhibited in so many other places inside and outside of industry. From the end of 2016 through August 2017, IP Consumer Goods was actually down slightly, pretty much the same lack of growth going back to 2015.
In the two months following, IP here jumped 1.6% on the storm aftermath, but has gained just 0.4% over the past four months through February 2018. |
US Industrial Production, Jan 2006 - 2018(see more posts on U.S. Industrial Production, ) |
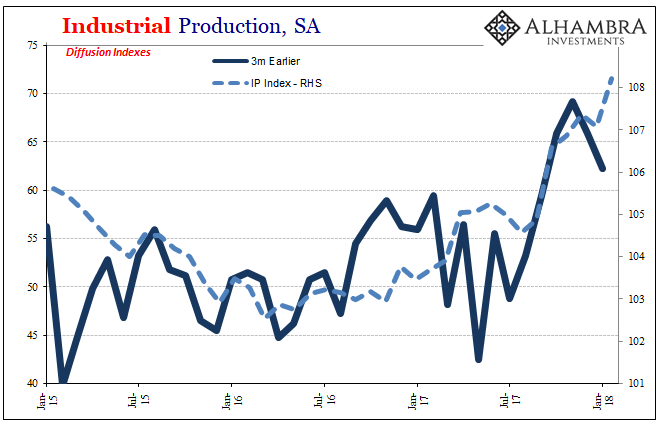
| Not only that, the diffusion indices are out of sync with February’s sharp rise in overall IP. That’s not necessarily conclusive, particularly given that these are all one month further in arrears, but there had been more consistency between them and overall production index especially in the emerging Harvey/Irma “cycle.” |
Us Industrial Production, Jan 2015 - 2018(see more posts on U.S. Industrial Production, ) |
Was February a good month in US industry, at least on par with 2014? It sure seemed that way, though what’s really at issue is whether it remains like this for more than just the one month. Automakers will have to deal with persisting lower sales and perhaps a tick up in inventory after February’s production bump (assuming it isn’t revised away next month). The oil sector might be facing further if relatively minor (compared to autos) headwinds in oil prices that haven’t budged since the end of January
It’s the same sort of problem as in the labor market. The economy is clearly still on its upswing, so a good month in any one part of it isn’t surprising. It’s getting those months to string together into a constant, uniform rise that’s been missing. Hurricanes aren’t nearly enough to do that, nor do these suggest whatever happened in February was, either.
Tags: consumer goods,currencies,economy,Energy,Featured,Federal Reserve/Monetary Policy,industrial production,manufacturing,Markets,Mining,Motor Vehicle Assemblies,newslettersent,OIL,shale,U.S. Industrial Production,U.S. Motor Vehicle Assemblies

