Pater Tenebrarum
My articles My siteAbout meMy booksMy videos
Follow on:TwitterFacebook
Seeking Alpha
Contradictory Signals Special antennae that help traders catch upcoming opportunities. Available from the same outfit that sells the soup-cooling spoon (Acme Inc). - Click to enlarge There is just one more positioning indicator we want to mention: after surging by around 6 billion since March of 2016, NYSE margin debt has reached a new all time high of more than 1 billion. The important point about this is that margin debt normally peaks well before the market does. Based on this indicator, one should not expect major upheaval anytime soon. There are exceptions to the rule though – see the caption below the chart. NYSE Margin Debt, 1965 - 2017A new all-time high in NYSE margin debt: this is in line with
Topics:
Pater Tenebrarum considers the following as important: Chart Update, Credit Markets, Debt and the Fallacies of Paper Money, Featured, newsletter, The Stock Market
This could be interesting, too:
Nachrichten Ticker - www.finanzen.ch writes Die Performance der Kryptowährungen in KW 9: Das hat sich bei Bitcoin, Ether & Co. getan
Nachrichten Ticker - www.finanzen.ch writes Wer verbirgt sich hinter der Ethereum-Technologie?
Martin Hartmann writes Eine Analyse nach den Lehren von Milton Friedman
Marc Chandler writes March 2025 Monthly
Contradictory Signals |
 Special antennae that help traders catch upcoming opportunities. Available from the same outfit that sells the soup-cooling spoon (Acme Inc). - Click to enlarge |
| There is just one more positioning indicator we want to mention: after surging by around $126 billion since March of 2016, NYSE margin debt has reached a new all time high of more than $561 billion. The important point about this is that margin debt normally peaks well before the market does. Based on this indicator, one should not expect major upheaval anytime soon. There are exceptions to the rule though – see the caption below the chart. |
NYSE Margin Debt, 1965 - 2017 A new all-time high in NYSE margin debt: this is in line with the other indicators shown here, and normally margin debt tends to peak before the market does. - Click to enlarge This is generally true – but not always. We found two major market peaks – namely the 1937 and 1973 tops – when margin debt peaked after the market had topped out. In 1937 it happened just one month after the top, in 1973 it happened 8 months after the top. Note also that at the 1937 market peak, there was no warning from the NYSE advance-decline line either – it topped almost concurrently with prices. |
| Since we discussed bubble blow-offs earlier this year (see: Speculative Blow-Offs in Stock Markets, Part 1 and Part 2), we have pointed out several times that an unusual number of diverging signals could be observed this year. And many signals we would normally expect to have appeared on the horizon by now are simply not in sight yet.
Consider for instance this chart from Moody’s, which we showed in one of our articles on credit spreads. It depicts debt as a percentage of internal company funds compared to actual and expected default rates. It is logical that these tend to be highly correlated, and yet, they are suddenly diverging rather noticeably. Similarly, current market valuations and sentiment/positioning data are at such rare extremes that we would normally expect to see a number of “confirming signals” elsewhere by now – but that is not the case. The sharp decline in broad true money supply growth continues as well. The latest update shows that y/y TMS-2 growth has fallen to just 2.78% in November, while commercial and industrial loan growth is barely clinging to positive territory: |
US Money Supply, Jul 2011 - Dec 2017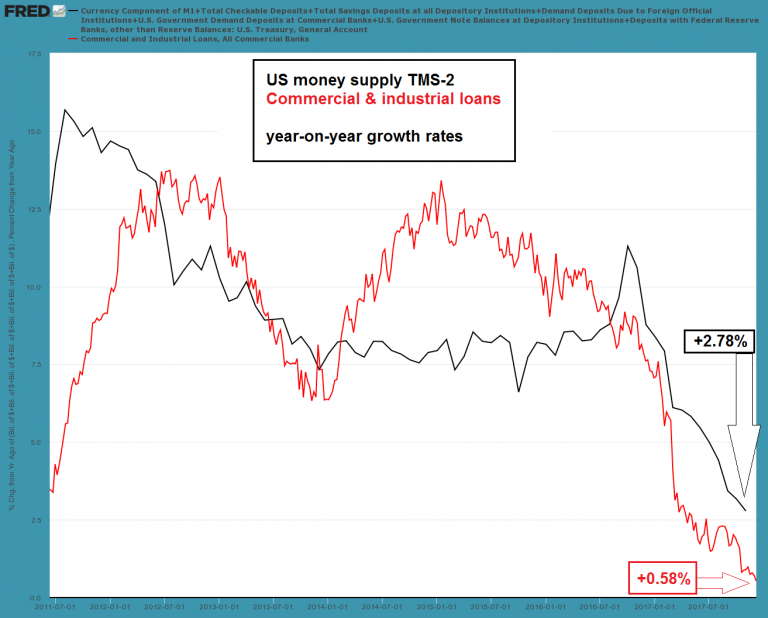 US money supply growth continues to tank rapidly – down another 38 basis points from the October level to just 2.78%, the lowest reading since April 2007. - Click to enlarge C&I lending growth has fallen again this week, the latest reading is actually even lower at 0.52%. |
| Valuations, sentiment data and money supply growth all suggest that the bubble should be on its last legs, or should at least be close to a major “correction”. However, if we look at the yield curve, it is still flattening – no significant reversal toward steepening has occurred yet (admittedly the recent speed of flattening can be seen as a kind of “Nimzovich threat”. Nimzovich once described a chess move as follows: “We aren’t threatening anything here. We are only threatening to threaten.”). |
YCZYR Yield Curve, Feb 2012 - Dec 2017 10 year minus 2 year spread: no sharp upside reversal is in sight yet, but the speed with which it is flattening is noteworthy - Click to enlarge |
| Also, none of the other early recession warning signals we usually see in economic data are in evidence: initial unemployment claims just made new lows at around 225K, ISM numbers are hovering near the top of their historical range (the manufacturing ISM is above 58 points) and real gross domestic private investment just hit a new record high. All of these normally tend to visibly deteriorate prior to recessions.
Lastly, market internals have not deteriorated to an overly alarming extent either. There is definitely some deterioration, which can e.g. be seen in the high density of “Hindenburg signals” given over the past year. However, the A/D line is at a new high, the percentage of stocks above their 50- and 200-day moving averages has recovered smartly, and our new highs/new lows percent indicator also continues to behave well (this one proved particularly useful in warning of corrections in recent years). Negatives on the technical front worth mentioning include the fact that several indexes are about as overbought on monthly charts as they ever get. For instance, the monthly RSI of the NDX stands at 81.49, a level that has only been seen in the run-up to the year 2000 peak and in late 2014 just before the end of QE3. The monthly RSI of the Dow Jones Industrial Average is at 87.57, likewise a level that is seen only very rarely (the last times were in 1986 and 1987 and in 1997/1998). Finally, there is a pesky and rather large divergence with European stock markets, which continue to be unable to overcome their early 2015 peak. This is actually funny, considering the ECB was the world’s biggest money printer over the past two years. Then again, the Europeans didn’t vote for anyone who wants to cut taxes and regulations (to be fair, they have generally not been offered that choice), so perhaps it makes sense from that perspective. |
S&P 500 Large Cap Index, Feb 2014 - Dec 2017(see more posts on S&P 500, )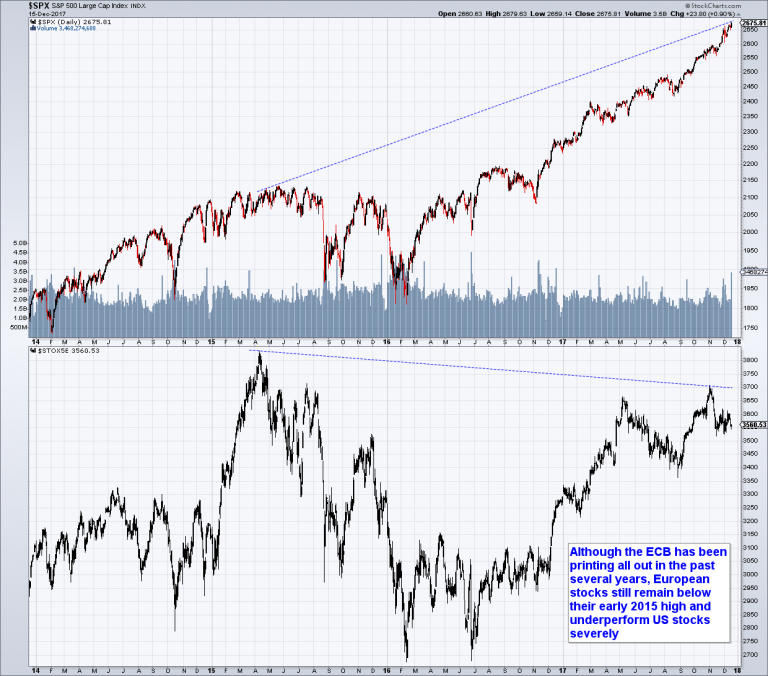 Once again there is a glaring divergence between US and European stocks – the latter continue to underperform severely - Click to enlarge |
A Conjecture About the Turning PointSo how could all of this actually play out? It seems possible, even highly probable to us that the answer has to do with structural features of the current asset bubble. Apparently one of the presenters at a recent Grant’s conference talked about something we have also long considered important: with respect to potential structural issues, the current environment is reminiscent of 1987. Here are excerpts from a remark we added to an article by Dimitri Speck on stock market seasonality in the month of October:
We should add to that: although the 1987 crash was not a prelude to a recession, money supply growth did decline sharply ahead of it, and the Fed had begun a rate hike campaign as well. Another thing worth pointing out is that the 1987 debacle was preceded by a classical “pre-crash pattern”. It was actually a very close analog to the 1929 crash pattern, a fact the then fledgling trading operation of Paul Tudor-Jones used to great advantage. Here is what the pattern looked like, including an annotation discussing some of the recurring phenomena we often observe just ahead of such abrupt declines (in particular, there will often be a sudden surge in volatility in both directions): |
Dow Jones Industrial Average Index, Aug - Dec 2017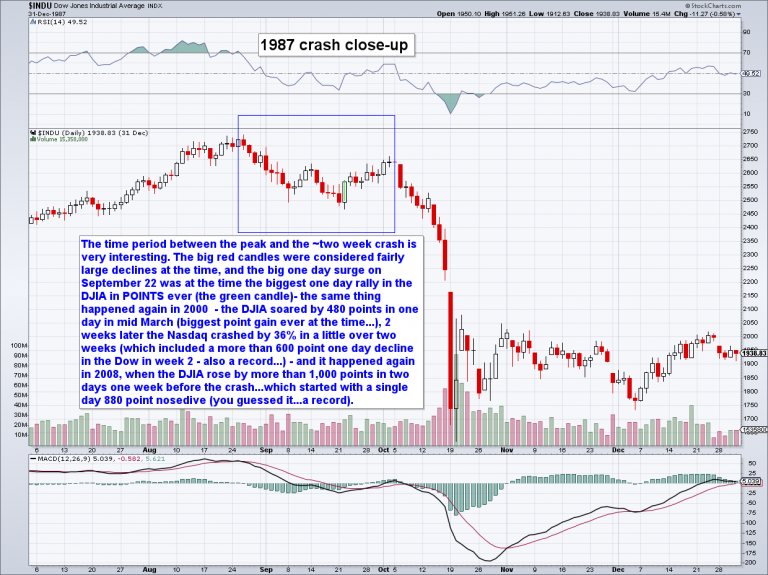 1987 was a “classical crash pattern”; it is quite interesting and unusual that this downturn did not herald a recession - Click to enlarge |
| Note that if not for current valuations and said structural features, we would not spend a lot of time considering low probability events such as crashes. Something has changed about these probabilities though. In 1987 one could still say “this is a once in a lifetime event”. By 2009 it had become an “event likely to happen umpteen times during one’s lifetime”.
Moreover, it should be clear that once rare valuation extremes are on deck, a large build-up of debt has occurred, market sentiment is at an extreme and markets are technically extremely “overbought”, these probabilities are definitely higher than usual. Actually, we cannot imagine that this bubble will expire with a whimper – when the air comes out, it will come out with a bang. Our conjecture is this: in today’s world, a lot of information is at everyone’s fingertips. A great many people keep an eye on the warning signals we mentioned above. If the market is to surprise the greatest possible number of observer-participants, something unusual will have to happen. Given the combination of signals we see right now, we think it is quite possible that assorted bubbles (of which the stock market is just one, but quite an important one) could expire without being preceded by recession warnings. Other warning signs may fail to appear as well. The rare exceptions to the leading indicator functions of peaks in margin debt and the A/D line we mentioned above show that this happens sometimes. We should actually expect that things will play out in a different way from before in the wake of the big QE experiment. Lastly, market structure issues created by the large-scale deployment of new computerized trading strategies are likely to be a decisive driver of the shape and speed of the denouement when it comes. We actually believe we have already seen “dress rehearsals” that are telling us something about what the main event might look like. One example is the May 2010 “flash crash”. Another, more recent one, was the mini-crash of the August 2015 expiration week. Let us take a look at it: |
Dow Jones Industrial Average Index, March - Dec 2017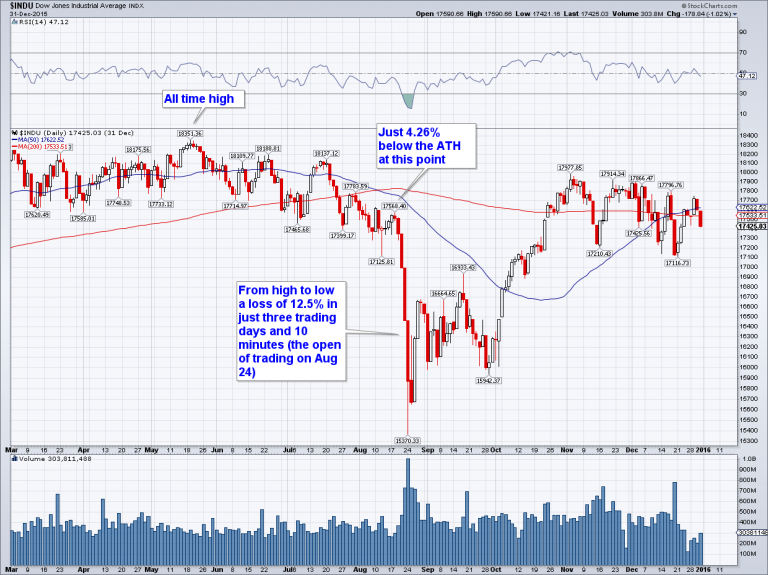 The August 2015 mini-crash struck out of the blue. - Click to enlarge Later we could hear all sorts of rationalizations and it was actually possible to come up with a fairly reasonable explanation of the technical processes involved, but no-one “predicted” this move – it surprised everybody. It was later argued that events in China had made the markets nervous, but China’s stock market had been crashing for months already, and its foreign exchange reserves had declined for many months as well (incidentally, they are lower today than they were then) |
What makes this move so remarkable is that it started from what looked like a fairly normal, harmless low-volatility consolidation and from a point that was a mere 4.26% below an all time high. That just isn’t supposed to happen; normally there is a lot more volatility before a crash-like move begins. As a rule of thumb one usually sees at least an 8% – 10% correction prior to a crash wave.
We concede that this decline was not a “proper” crash – the percentage decline was not large enough to qualify it as one. That doesn’t matter though – what mainly interest us here is the way in which it happened. Keep in mind that the post mortem pointed fingers at “risk parity” and “volatility targeting” strategies as well as trend-following CTAs, as they all had their sell stops triggered. If memory serves, this was the sequence of events:
When the decline started, one of the problems was that treasury bonds were weak as well. This is anathema to risk parity funds, which rely on the inverse correlation between stocks and government bonds in times of stress. At the beginning of the decline, their selling added to the pressure.
Note also, because the market had gone sideways for some time ahead of the event, its small decline from the all time high was enough to push the DJIA below both the 50- and 200-day moving average and produce a “death cross” in the process. This may actually have provided the initial sell trigger for some traders.
The VIX was very low when the move started, but moved up rapidly. So the next type of automated strategy received a sell signal – volatility targeting strategies lower their exposure to equities as soon as volatility rises (and increase it when it falls). Since all these strategies use leverage, it is important that they stick to a discipline, but the problem is that a lot of money is invested in them by now. In short, their discipline will trigger decidedly undisciplined market declines (here are acoustic representations of discipline and indiscipline for connoisseurs).
Trend-followers obviously had their fingers on the trigger as well, given the fact that the market had been “trendless” for a while. The main point is that it really didn’t take much for the market to suffer this major conniption. It may be worth studying everything that happened just prior to this event. Intra-market correlations, technical indicators, economic indicators, etc., as the combination of signals that generated this outcome is contained in these data.
Now consider that US true money supply growth was still above 8% p.a. at the time, and while valuations were stretched, they were not yet as absurd as they are now. In short, the current backdrop looks a lot more dangerous.
Conclusion
In light of the speculative blow-off in the stock market, one has to prepare for a potential reversal, but it is not an easy task. If our idea of how things may play out proves correct, there will be relatively little warning and things will happen very quickly. Timing is made even more difficult by this than it already is under normal circumstances. It also remains difficult to gauge how much big the blow-off will become prior reversing.
We personally believe it is close to the point of exhaustion, but we have thought so before. Sentiment and positioning extremes have failed to provide any reliable signals in recent years (except at interim lows), so the current crop of new records may be less meaningful than we think. The lagged effects of the decrease in money supply growth are inescapable, but the duration of the lag cannot be determined with certainty in advance.
Having said all that, the expected value of avoiding large drawdowns or alternatively catching a large initial decline (e.g. with options) is very large. And since selling volatility has become so popular, one can buy options at very low prices. In other words, we believe this is probably a very good time to consider betting on tail risk, with a strategy similar to that employed by Nassim Taleb’s Universa fund (we don’t know the current status of this fund, but its strategy involved buying tail risk put options for a small percentage of its AUM, while otherwise investing in safe fixed interest products).
That way one can circumvent the timing problem to some extent – in fact, we have no better idea for accomplishing that. As an aside, note that several large historical asset bubbles have peaked near, or right at the turn of the year (gold on January 20 1980, Nikkei on Dec. 31 1989, the DJIA on Jan. 7 1973).
Tags: Chart Update,Credit Markets,Featured,newsletter,The Stock Market