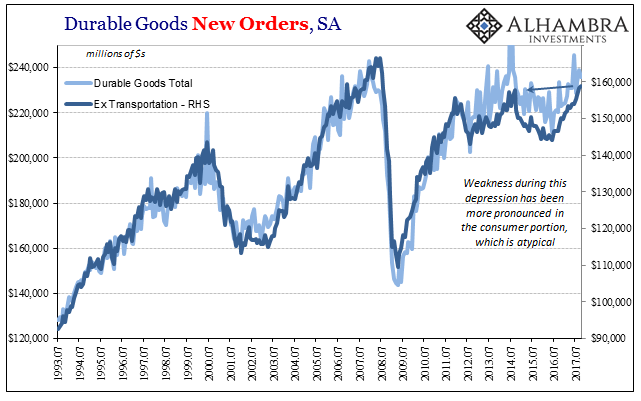
Durable goods were boosted for a second month by the after-effects of Harvey and Irma. New orders excluding those from transportation industries rose 8.5% year-over-year in October 2017, a slight acceleration from the 6.5% average of the four previous months. Shipments of durable goods (ex transportation) also rose by 8% last month. US Core Durable Goods Orders, Jan 1993 - Jan 2017(see more posts on U.S. Core Durable Goods Orders, ) - Click to enlarge Even with that slight quickening, these are not growth rates consistent with healthy economic conditions. Instead, the rebound in durable goods in 2017 is mimicking almost perfectly the one in 2014; at least rates consistent with what that prior upturn had
Topics:
Jeffrey P. Snider considers the following as important: capital goods, currencies, durable goods, economy, Featured, Federal Reserve/Monetary Policy, inflation, Markets, new orders, newsletter, pce deflator, shipments, The United States, U.S. Core Durable Goods Orders
This could be interesting, too:
Nachrichten Ticker - www.finanzen.ch writes Die Performance der Kryptowährungen in KW 9: Das hat sich bei Bitcoin, Ether & Co. getan
Nachrichten Ticker - www.finanzen.ch writes Wer verbirgt sich hinter der Ethereum-Technologie?
Martin Hartmann writes Eine Analyse nach den Lehren von Milton Friedman
Marc Chandler writes March 2025 Monthly
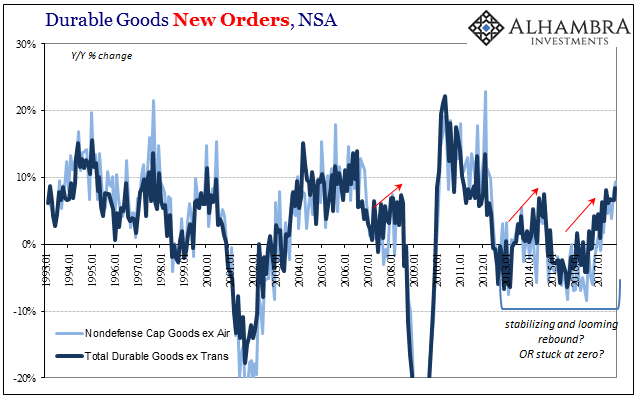
| Durable goods were boosted for a second month by the after-effects of Harvey and Irma. New orders excluding those from transportation industries rose 8.5% year-over-year in October 2017, a slight acceleration from the 6.5% average of the four previous months. Shipments of durable goods (ex transportation) also rose by 8% last month. |
US Core Durable Goods Orders, Jan 1993 - Jan 2017(see more posts on U.S. Core Durable Goods Orders, ) |
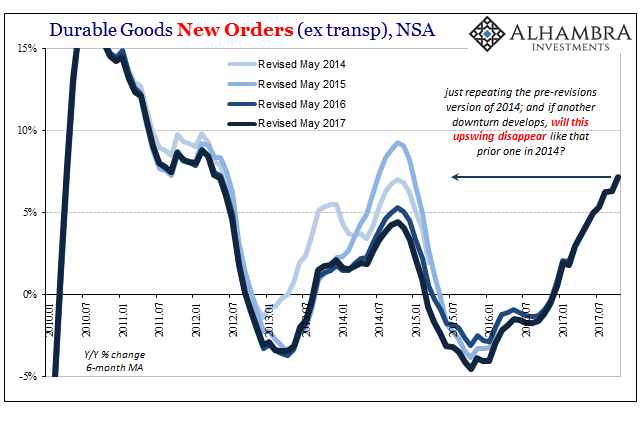
| Even with that slight quickening, these are not growth rates consistent with healthy economic conditions. Instead, the rebound in durable goods in 2017 is mimicking almost perfectly the one in 2014; at least rates consistent with what that prior upturn had produced before more comprehensive data forced significant downward revisions. |
US Core Durable Goods Orders, Jan 2010 - Jul 2017(see more posts on U.S. Core Durable Goods Orders, ) |
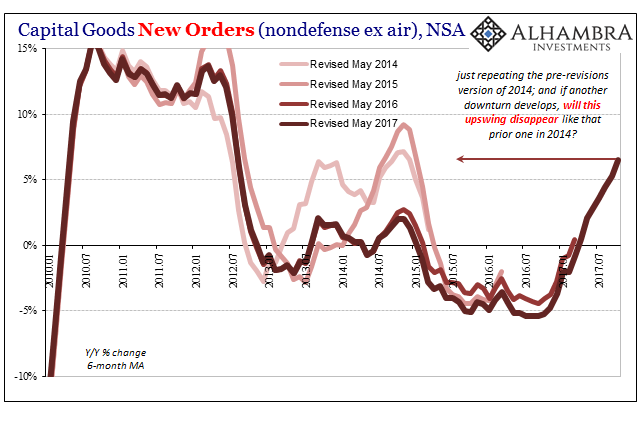
| It’s difficult to illustrate just how lackluster this growth has been, particularly when going from a few years of -5% or so appears to be totally different at +6% to +8%. The charts above sure look like acceleration and growth. |
US Core Capital Goods Orders, Jan 2010 - Jul 2017 |
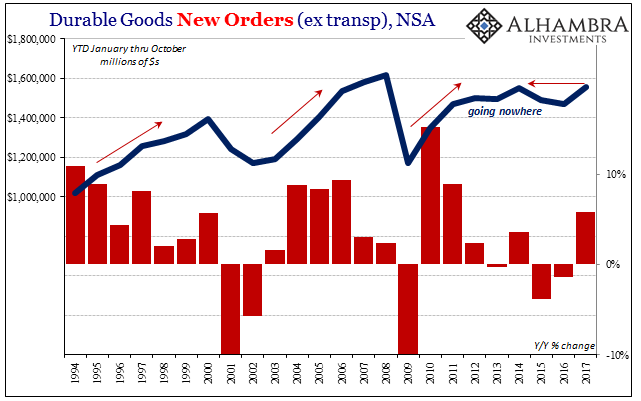
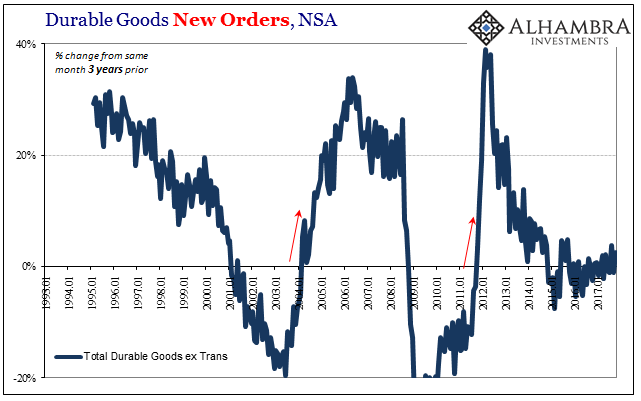
| But the unadjusted total for orders in October was $159.5 billion, barely more than new orders for durable goods in October 2014 three years ago ($155.5 billion). In fact, year-to-date 2017 new orders total about $1.558 trillion, about flat when compared to the same months in 2014 ($1.552 trillion). |
US Core Durable Goods Orders, 1994 - 2017(see more posts on U.S. Core Durable Goods Orders, ) |
| We pay attention exclusively to how new orders are up 8% year-over-year in October without ever accounting for how they are mostly flat or less across these longer timeframes. The reason is that it isn’t readily apparent why the three-year comparison would matter, after all when whatever account is positive and growing historically speaking everything is positive and growing. |
US Core Durable Goods Orders, Jul 1993 - 2017(see more posts on U.S. Core Durable Goods Orders, ) |
| We cannot, however, just ignore this clear lack of momentum, first because it is a-historic, and second because the real economy can’t and doesn’t (just ask the oil market). Economic momentum counts, and if business today is barely even or slightly above business in 2014 that’s not a good sign about the future – even if today is better than last year. |
US Core Durable Goods Orders, Jan 1993 - 2017(see more posts on U.S. Core Durable Goods Orders, ) |
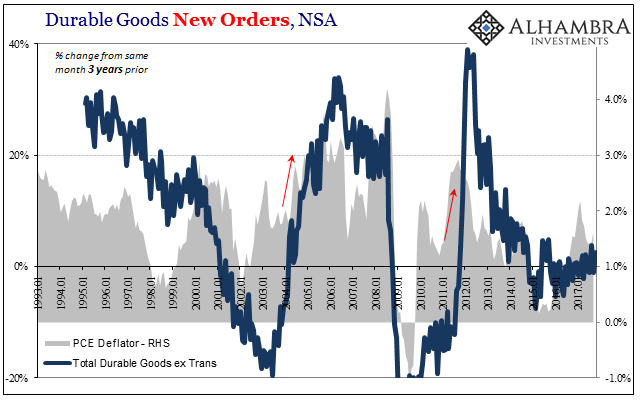
| People arguing for a jump in inflation should pay close attention to the chart above, not because the PCE Deflator is derived substantially from anything in durable goods but instead what ties the two together: momentum. |
US Core Durable Goods Orders, Jan 1993 - 2017(see more posts on U.S. Core Durable Goods Orders, ) |
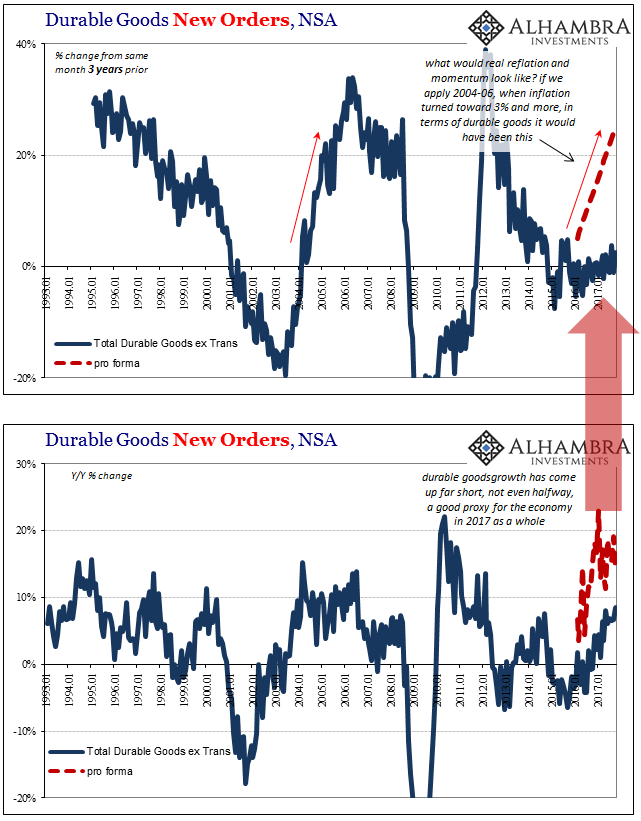
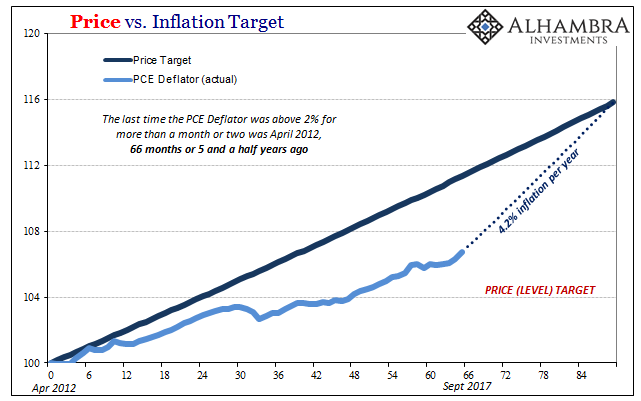
| Economic momentum and monetary momentum are two sides of the same coin, the net result being inflation. Since 2011, the economy has exhibited very little of it, leaving the PCE Deflator five and a half years below the Fed’s explicit inflation target for that consumer price measure. That slowdown is not exclusively a product of just the downturns, it is made equally as much by the lack of forceful upturns following them.
It suggests what economists are always afraid of in these kinds of circumstances, the permanent or durable changes to behavior that make it much harder for the economy as a whole to get back up again. Disbelief is a powerful inhibitor, especially in the face of so much “stimulus” that didn’t stimulate. Many economic participants may get the sense that the economic problem is intractable, therefore becoming normalized to a zero-growth baseline. |
US Core Durable Goods Orders, Jan 1993 - 2017(see more posts on U.S. Core Durable Goods Orders, ) |
| After enough time, even the most normal of cyclical tendencies (that which make up a recovery as different from a mere upturn) become jaded by persistent lack of actual progress and growth. I think that is what we are seeing throughout this year as “reflation” hopes once again come up far short of what the term actually suggests. Durable goods, as compared to other economic data, are actually among the better indications and yet are still hugely disappointing in that respect. |
Price vs Inflation, Sep 2017 |
Tags: capital goods,currencies,durable goods,economy,Featured,Federal Reserve/Monetary Policy,inflation,Markets,new orders,newsletter,pce deflator,shipments,U.S. Core Durable Goods Orders

