Summary:
Dismal Earnings, Extreme Valuations
The current earnings season hasn’t been very good so far. Companies continue to “beat expectations” of course, but this is just a silly game. The stock market’s valuation is already between the highest and third highest in history depending on how it is measured.
Photo credit: Kjetil Ree
Corporate earnings are clearly weakening, and yet, the market keeps climbing. The rally is a bit of a “all of worry” type of phenomenon actually, since many of the negatives are of course widely known.
The S&P 500 and the Nasdaq Composite, daily. The vertical blue bar on the right shows the range we expected the rebound to be contained in – this has now clearly been exceeded. However, the technology sector continues to underperform the broader market in this rally – click to enlarge.
After the immediate crash danger receded in February, we expected that a sizable rebound would be in the offing, but it is fair to say that the rebound has by now gone quite a bit further than we expected, if not by much yet. In fact, the S&P 500 Index is almost back at the level of early November as we write this.
Note though that the Nasdaq continues to underperform in the current rally – which has been mainly driven by sectors that were previously weak.
Topics:
Pater Tenebrarum considers the following as important:
Chart Update,
Debt and the Fallacies of Paper Money,
Featured,
newsletter,
stock market overvalued
This could be interesting, too:
Nachrichten Ticker - www.finanzen.ch writes Die Performance der Kryptowährungen in KW 9: Das hat sich bei Bitcoin, Ether & Co. getan
Nachrichten Ticker - www.finanzen.ch writes Wer verbirgt sich hinter der Ethereum-Technologie?
Martin Hartmann writes Eine Analyse nach den Lehren von Milton Friedman
Marc Chandler writes March 2025 Monthly
Dismal Earnings, Extreme Valuations
The current earnings season hasn’t been very good so far. Companies continue to “beat expectations” of course, but this is just a silly game. The stock market’s valuation is already between the highest and third highest in history depending on how it is measured.

Photo credit: Kjetil Ree
Corporate earnings are clearly weakening, and yet, the market keeps climbing. The rally is a bit of a “all of worry” type of phenomenon actually, since many of the negatives are of course widely known.
The S&P 500 and the Nasdaq Composite, daily. The vertical blue bar on the right shows the range we expected the rebound to be contained in – this has now clearly been exceeded. However, the technology sector continues to underperform the broader market in this rally – click to enlarge.
|
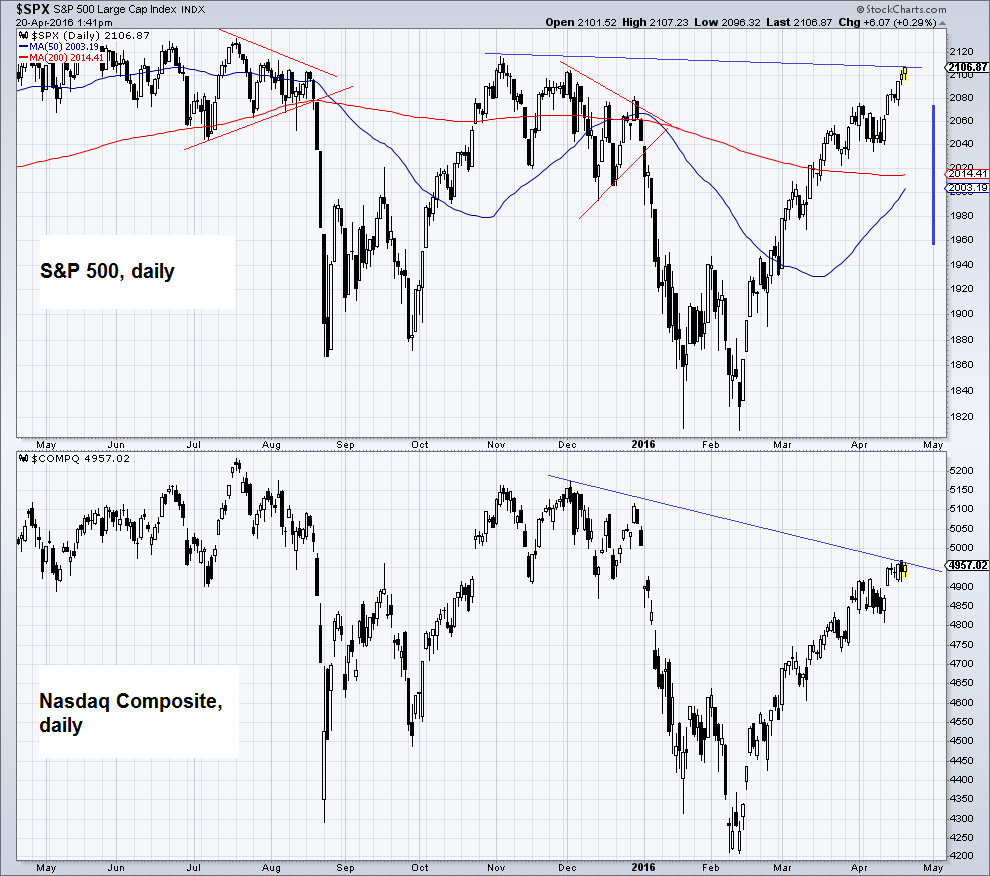 |
After the immediate crash danger receded in February, we expected that a sizable rebound would be in the offing, but it is fair to say that the rebound has by now gone quite a bit further than we expected, if not by much yet. In fact, the S&P 500 Index is almost back at the level of early November as we write this.
Note though that the Nasdaq continues to underperform in the current rally – which has been mainly driven by sectors that were previously weak. In the process, market internals have improved considerably, but the former leading sectors all remain well below their previous peaks. So all is not well just yet, even from a technical perspective.
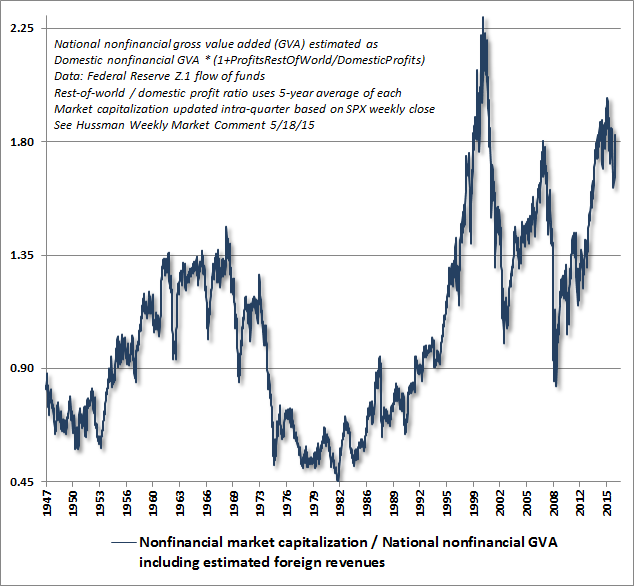
To see how extremely overvalued the market is, take a look at the chart below,
provided by John Hussman, which measures stock market valuation as the ratio of non-financial market capitalization to national non-financial gross value added, including estimated foreign revenues (note: due to stronger internals, Dr. Hussman is currently not strongly bearish in the short term).
In terms of this measure, the market has only been more overvalued than today at the peaks of 1929 and 1999/2000. 1937 came close as well.
|
 |
We should add that the recent combination of rising stock prices and declining earnings has driven the market’s trailing P/E ratio to its second-highest level in history (we are only considering bull market extremes – in 2008/9, a collapse in earnings drove P/Es even higher). However, at e.g. the 1929 market peak, the S&P’s dividend yield actually exceeded today’s by more than 50% (to be fair, bond yields were significantly higher as well).
Anyway, the main point we want to make is that from a valuation standpoint, investors are playing with fire. Obviously, neither declining earnings nor extreme valuations mean that the market has to decline or cannot keep rising even further. After all, it has happened before. Moreover, the opposite can happen as well: in 1973-1974, S&P 500 earnings rose every quarter – and yet, the market fell by 56%.
Over the long term, the stock market actually rises approximately 67% of the time. The reason why it makes sense to try to identify bear markets ahead of their occurrence is not that they happen very often – the main reason is that recovering from big drawdowns is quite hard and can sometimes take a very long time.
Contrary to the buy and hold philosophy, one can actually achieve far better long term returns by avoiding big drawdowns, even if one misses some of the market’s upside due to being cautious. One can get very unlucky if one fails to side-step bear markets, such as recently happened to all those invested in Greek and Cypriot stocks, which lost 92%, resp. 99% from their peak levels.
After the large bear market of the early 30’s, it took the US market 25 years to regain its nominal peak. It is not yet known when Japan’s market will make investors whole who have been holding since the 1980s. Most presumably won’t live to see the day. So why is the market
currently so strong, and why does it actually rise such a large percentage of the time?
The Cause of Nominal Price Gains
First of all we should note that in spite of the phenomenal advance between 2009 and early 2015, in real terms buy & holders of a broad market benchmark index have not much to write home about over the past 16 years. They are basically treading water (if they had the nerve to hold through two of the biggest bear markets in history that is).
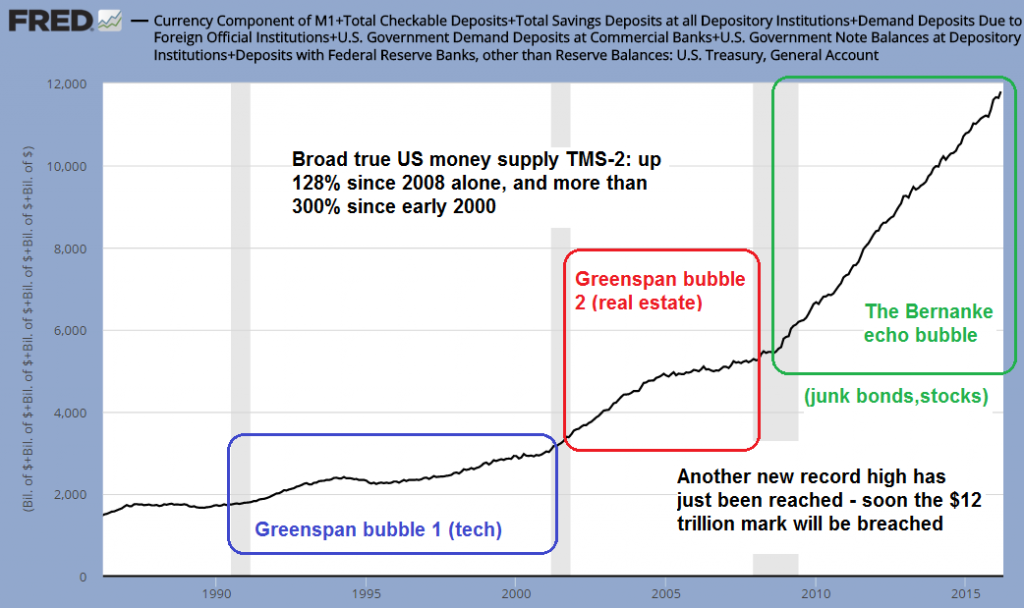
Nominal gains in stock prices are largely a function of monetary inflation. At the moment, there is still plenty of monetary inflation in the US and Europe, and it is not certain for how long its lagged effects will affect stocks. The level and trend of stock prices is actually not an indicator of the economy’s health. It is primarily an indicator of money supply inflation, even though the correlation is largely a long term phenomenon, and subject to significant leads and lags, which in turn are greatly influenced by investor perceptions.
US money supply TMS-2 and the associated asset price booms since the late 1980s – click to enlarge.
|
 |
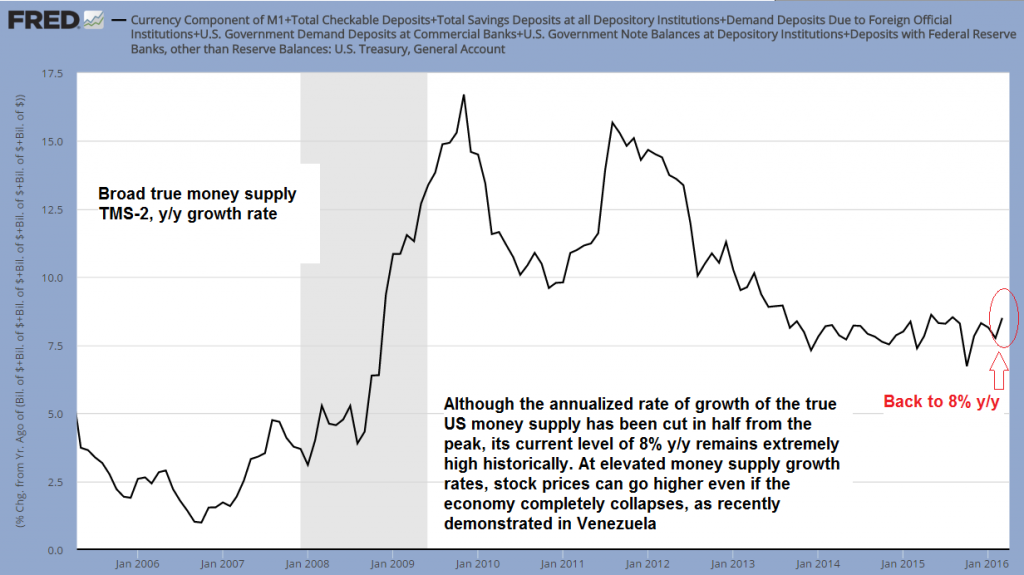
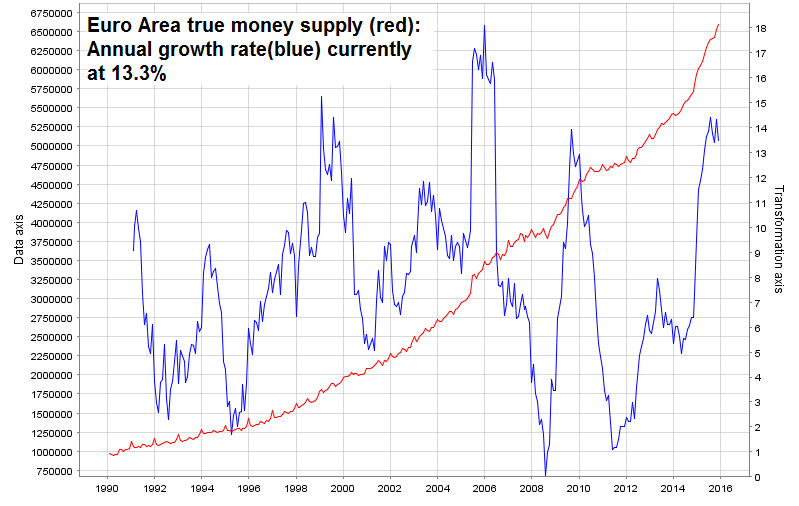
Currently, the true money supply is growing at 8% y/y in the US, and 13.3% y/y in the euro zone. This remains historically a very high level, even though US money supply growth is well down from its 2009 and 2011 peaks:
TMS-2, annual growth rate – click to enlarge.
|
 |
Euro area – this is actually M1, i.e., currency and demand deposits, incl. savings deposits available on demand. It excludes foreign resident euro deposits, so is only a close approximation of TMS, but good enough for our purposes – click to enlarge.
|
 |
The next chart illustrates quite starkly that stock prices are not an indicator of the economy’s health. It shows one of the nominally best performing stock markets in the world:
It cannot be seen on this linear chart, but in 2002 the IBC General Index in Caracas traded at just 6 points. It stands at more than 16,000 points today, after rising more than 16-fold since early 2013 alone – click to enlarge.
|
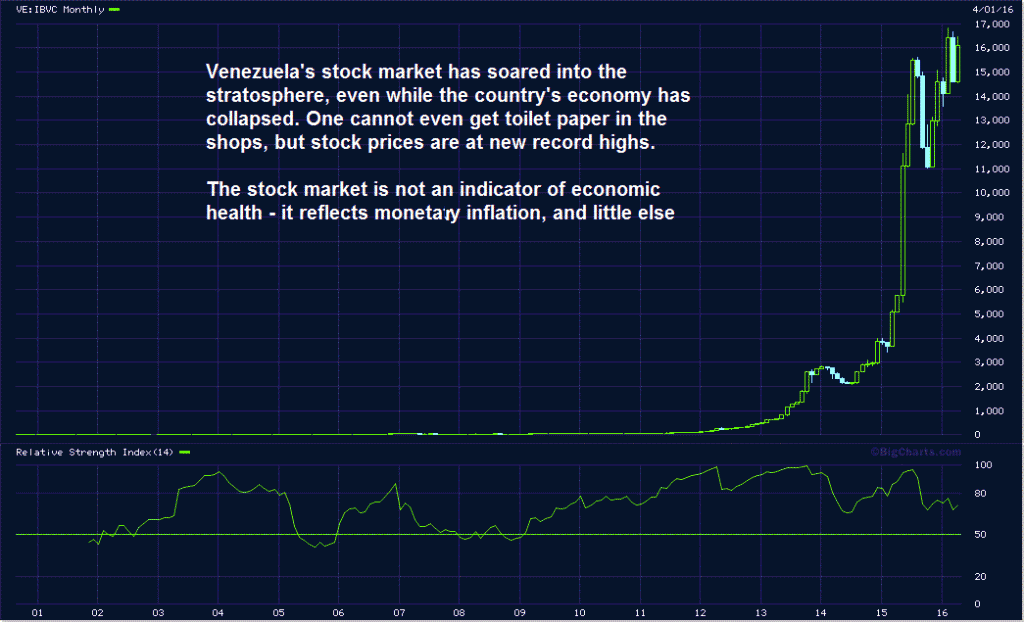 |
Venezuela’s economy is in such a bad state, that people have to queue for hours to acquire staples like bread, oil, flour or toilet paper. All these goods are rationed these days. There is hyperinflation and the government has taken numerous financial repression type measures so as to contain capital flight.
As a result, investors in Venezuela are trying to preserve their wealth by buying stocks, which represent claims to real assets, while corporate debt has been inflated away. In this particular case it is of course glaringly obvious what an important role monetary inflation plays in the stock market’s trend.
Venezuela’s situation is of course not comparable to that of developed economies. Our assumption is that central banks in the developed world may well be prepared to tolerate a certain degree of “price inflation” beyond their official targets, but they will attempt to counter it if it becomes too great.
As the 1970s have shown, high price inflation that stops well short of hyperinflation is something that causes investors to assign much lower multiples to stocks, as rising nominal earnings are no longer considered to be worth as much. This is however certainly not a near term concern.
For the current market rally to continue, other things have to go just right – quite a few of them we think. To name just three: it is inter alia predicated on the belief that a) central bank largesse will continue to an extent sufficient to keep all the plates in the air, b) that weak earnings and the huge amount of debt corporations have amassed won’t choke off the buyback spigot, and c) that the recent rise in US core inflation rates is really only a temporary affair and doesn’t accelerate to a point that forces to Fed to alter its dovish policy stance.
Conclusion
It cannot be ruled out that the stock market will eventually break out to new highs – but its long term returns are still going to be valuation-dependent. In the short term, there remains the fact that while some indexes are close to their previous highs and internals have strengthened, other indexes continue to diverge noticeably.
Although money supply growth remains historically strong and investors are desperately chasing returns in today’s ZIRP world and are therefore evidently prepared to take much greater risks than they otherwise would, an extremely overvalued market is always highly vulnerable to a change in perceptions.
High rates of monetary inflation during the echo bubble period and the weakness of the accompanying economic recovery suggest that the threshold at which the pace of money supply growth will become too slow to maintain asset prices at such lofty levels is much higher than it used to be. So in a sense the rebound may actually turn out to be self-defeating, as it will increase the Fed’s willingness resume tightening policy.
Charts by: StockCharts, St. Louis Federal Reserve Research, ECB, BigCharts


