Quantitative analysis points to parallels between state of equity markets today and markets 17 years agoThere are many similarities between the current period and 1999. Then, just as now, we were in the midst of a technology-led bull market following a housing-related recession, central banks were experimenting with very loose monetary policy, there had been a big drop in emerging markets and commodities in the previous year or so, and we had recently gone through a currency-related crisis in Europe (European Monetary System then, euro now).There are several broad quantitative analytical approaches to measuring the similarities. Here at Pictet, we have used artificial intelligence (AI) as one of several independent ways of validating our battery of leading indicators for market prices, the latter being constructed using only published fundamental data.A proprietary approach is used to measure the degree of similarity between periods (more specifically, various periods of time leading up to August 2016 from the point of view of an array of macroeconomic, company and market data. The results are shown on the above chart, with the degree of similarity ranging from 0 (no similarity) to 100 (greatest similarity):The three periods with highest similarity to the period leading up to August 2016 (all of which were followed by bull markets) were:July 1999: 59.
Topics:
Edgar van Tuyll van Serooskerken considers the following as important: Analytical models, Artificial intelligence, Perspectives, quantitative analysis
This could be interesting, too:
Perspectives Pictet writes The era of economic slowbalisation
Perspectives Pictet writes The year of the doves
Perspectives Pictet writes “The Three Amigos”
Perspectives Pictet writes Unravelling knotty issues
Quantitative analysis points to parallels between state of equity markets today and markets 17 years ago
There are many similarities between the current period and 1999. Then, just as now, we were in the midst of a technology-led bull market following a housing-related recession, central banks were experimenting with very loose monetary policy, there had been a big drop in emerging markets and commodities in the previous year or so, and we had recently gone through a currency-related crisis in Europe (European Monetary System then, euro now).
There are several broad quantitative analytical approaches to measuring the similarities. Here at Pictet, we have used artificial intelligence (AI) as one of several independent ways of validating our battery of leading indicators for market prices, the latter being constructed using only published fundamental data.
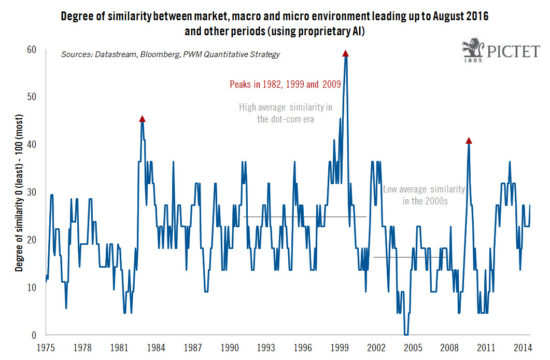
A proprietary approach is used to measure the degree of similarity between periods (more specifically, various periods of time leading up to August 2016 from the point of view of an array of macroeconomic, company and market data. The results are shown on the above chart, with the degree of similarity ranging from 0 (no similarity) to 100 (greatest similarity):
The three periods with highest similarity to the period leading up to August 2016 (all of which were followed by bull markets) were:
- July 1999: 59.1
- December 1982: 45.4
- August 2009: 40.9
Using quantitative analysis, the similarity between today and various lengths of time immediately preceding major past peaks in the MSCI All Country Index is much lower. The degree of similarity between today and October 2007 is 18.2 (the peak in stock indexes before the financial crisis) and between today and March 2000 (when the dot-com bubble reached a climax) is 27.3. As shown on the chart, there is a high overall similarity between the state of equity markets today and the 1990s dot-com period and a low overall similarity with the post-dot com recovery in stocks, which was led by housing and emerging markets in the first decade of the 2000s.
Read article on Quantitative Analysis in Perspectives, July 2016