Thursday , May 2 2024
Home / Edgar van Tuyll van Serooskerken

Edgar van Tuyll van Serooskerken

Do not hesitate to contact Pictet for an investment proposal. Please contact Zurich Office or the Geneva Office

Articles by Edgar van Tuyll van Serooskerken

Crypto-currencies in a bubble

May 19, 2017

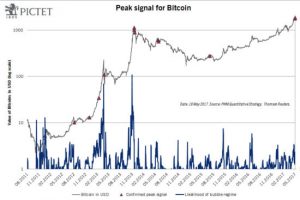
Crypto-currencies like Bitcoin and Ripple are caught in a “bubble regime”, oscillating between extreme peaks and troughs. A new peak is close….Pictet’s inhouse quantitative analysis can provide ways of spotting certain kinds of bubble and predicting when they will burst (see article ‘Forecasting Financial Extremes’).One aspect of this analysis is focused on investor herding behaviour, as measured by the combination of super-exponential cycles and ever faster oscillations around those cycles. Peaks and troughs in these cycles are the moments when these oscillations become infinitely fast.Sometimes, in periods that might be called “bubble regimes”, various assets caught in these super-exponential cycles move permanently between bubble and crash territory instead of following the usual trajectory for stock prices. Examples can be found in the behavior of stocks on the following indexes:Hong Kong’s Hang Seng from 1967 to the peak of the Asian Crisis in 1997.Japan’s Topix from 1982 to 2009, the period covering the inflation and deflation of the Japanese asset bubble.The Nasdaq from 1995 to 2003, the period of the dot.com bubble and burst.Stowe’s Global Coal Index from 2006 to 2008, a period that covered growth and recession in China.Which assets are in a “bubble regime” today? In our view, crypto-currencies are.

Read More »

Similarities between August 2016 and July 1999

August 9, 2016

Quantitative analysis points to parallels between state of equity markets today and markets 17 years agoThere are many similarities between the current period and 1999. Then, just as now, we were in the midst of a technology-led bull market following a housing-related recession, central banks were experimenting with very loose monetary policy, there had been a big drop in emerging markets and commodities in the previous year or so, and we had recently gone through a currency-related crisis in Europe (European Monetary System then, euro now).There are several broad quantitative analytical approaches to measuring the similarities. Here at Pictet, we have used artificial intelligence (AI) as one of several independent ways of validating our battery of leading indicators for market prices, the latter being constructed using only published fundamental data.A proprietary approach is used to measure the degree of similarity between periods (more specifically, various periods of time leading up to August 2016 from the point of view of an array of macroeconomic, company and market data. The results are shown on the above chart, with the degree of similarity ranging from 0 (no similarity) to 100 (greatest similarity):The three periods with highest similarity to the period leading up to August 2016 (all of which were followed by bull markets) were:July 1999: 59.

Read More »