The ECB will likely remain under pressure to act (again) in 2016. We see the risks tilted towards additional monetary stimulus by Q2 2016. Euro area HICP inflation was revised slightly higher in today’s Eurostat report, to +0.20% y-o-y in November (from 0.14% in the flash estimate to 0.15% in the final figure on the back of marginally stronger food and energy prices). Base effects are expected to push inflation higher in the next few months, although the renewed decline in oil prices will put a cap on headline HICP, most likely peaking below 1.0% in Q1 2016. Beyond this energy-induced volatility, core inflation has remained relatively stable in the past six months (at 0.95% on average), having risen slightly from H2 2014 levels (0.75% on average). HICP excluding energy, food, alcohol and tobacco stood at 0.93% y-o-y in November, in line with its average over the past 6 months. We expect core HICP inflation to be the single most important driver of ECB policy in 2016, for a number of reasons: The ECB has always been looking through the noise and distortions created by volatility in commodity prices. Even though the price stability objective is defined in terms of total inflation, the ECB has placed a growing emphasis on measures of core prices recently.
Topics:
Frederik Ducrozet and Nadia Gharbi considers the following as important: Macroview
This could be interesting, too:
Cesar Perez Ruiz writes Weekly View – Big Splits
Cesar Perez Ruiz writes Weekly View – Central Bank Halloween
Cesar Perez Ruiz writes Weekly View – Widening bottlenecks
Cesar Perez Ruiz writes Weekly View – Debt ceiling deadline postponed
The ECB will likely remain under pressure to act (again) in 2016. We see the risks tilted towards additional monetary stimulus by Q2 2016.
Euro area HICP inflation was revised slightly higher in today’s Eurostat report, to +0.20% y-o-y in November (from 0.14% in the flash estimate to 0.15% in the final figure on the back of marginally stronger food and energy prices). Base effects are expected to push inflation higher in the next few months, although the renewed decline in oil prices will put a cap on headline HICP, most likely peaking below 1.0% in Q1 2016. Beyond this energy-induced volatility, core inflation has remained relatively stable in the past six months (at 0.95% on average), having risen slightly from H2 2014 levels (0.75% on average). HICP excluding energy, food, alcohol and tobacco stood at 0.93% y-o-y in November, in line with its average over the past 6 months.
We expect core HICP inflation to be the single most important driver of ECB policy in 2016, for a number of reasons:
- The ECB has always been looking through the noise and distortions created by volatility in commodity prices. Even though the price stability objective is defined in terms of total inflation, the ECB has placed a growing emphasis on measures of core prices recently.
- The longer headline inflation remains below the target, the higher the risks to price stability and to the anchoring of expectations. The ECB is focusing on core inflation as a measure of potential second-round effects from low energy prices on other HICP components.
- ECB staff forecasts include an increase in core inflation to 1.3% in 2016, and 1.6% in 2017. The latter projection looks optimistic and risks are indeed tilted to the downside, keeping the pressure on the ECB to respond to any further disappointment in price data.
- Globally, the Phillips curve debate has not been settled, the key issue being the size of the output gap and its impact on wage/price dynamics. A recent IMF paper highlighted hysteresis as one specific factor that might be at play, especially in the euro area, where the degree of economic slack remains significant.
In this note we take stock of recent developments in various measures of underlying inflation in the area. In a separate piece, we will assess the medium-term outlook for price stability. Although we expect HICP inflation to gradually rise towards the 2% target by 2018, the normalisation of core inflation risks being slower than anticipated by the ECB, possibly calling for additional monetary stimulus in H1 2016.
A relatively consistent message from various measures of underlying inflation
The turning point reached by headline inflation in January 2015 has been less pronounced for core inflation, largely due to energy base effects. However, cross-checking with a broad set of measures might help us to gauge the “real” trend of underlying inflation. The ECB uses a wide range of indicators to access underlying inflation dynamics.
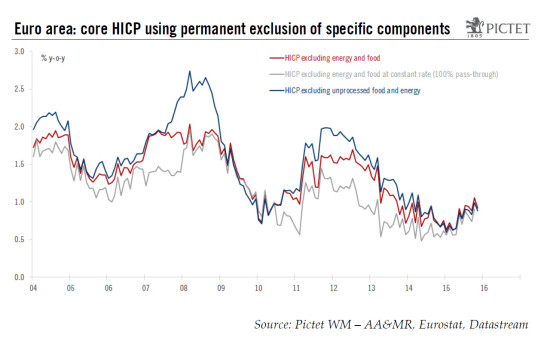
A first group includes permanent exclusion-based measures, which remove the same items from HICP indices on a permanent basis: HICP inflation excluding energy, HICP inflation excluding unprocessed food and energy and HICP excluding energy and food.
Within this first group, one can include measures of inflation at constant tax rate, which make it possible to gauge the potential impact of changes in indirect taxes (i.e. VAT and excise duties). Unfortunately, Eurostat does not publish data series on core inflation at constant tax rate, but we can use arbitrary assumptions in terms of the tax effect and pass-through to core inflation of 100% or 50% (see chart below).
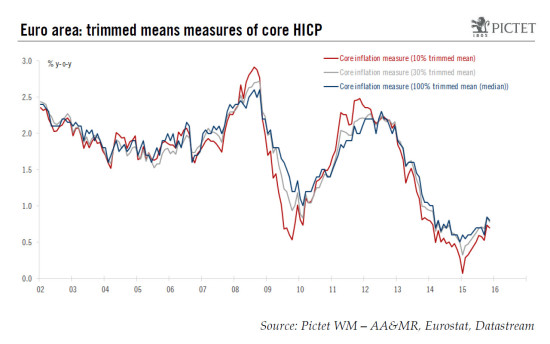
A second group includes statistical exclusion-based measures which remove items based on a statistical criterion. Various trimmed means are displayed in the chart below, taking out the impact of individual items with the highest and lowest levels of inflation rate (10%, 30% or 100% median). All those measures show an encouraging, albeit still limited upward trend in 2015.
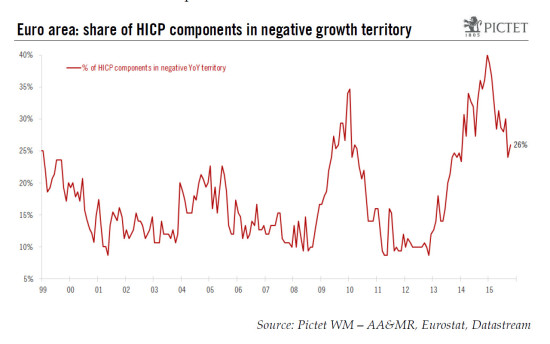
A third group includes model-based measures of underlying inflation that rely on econometrical tools to assess underlying price pressures (see an ECB box for further details) while diffusion indices try and capture the internal dynamics of HICP sub-components. The simple chart below shows the share of HICP components with a negative annual growth rate, at 26% in November, down from a peak of 40% in December 2014.
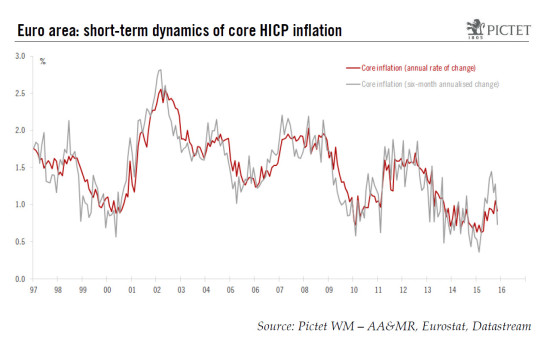
Lastly, the chart below shows the 6-month annualised growth rate of core HICP, down to 0.7% in November, following a relatively strong pick-up in H1 2015.
Overall, looking at the available set of measures, the relatively consistent message is that the underlying rate of inflation in the euro area has risen modestly from its Q1 2015 lows but the momentum remains subdued, echoing Draghi’s comments about a “somewhat weaker” medium-term outlook.
Core inflation likely to rise in 2016, but the ECB might still be disappointed
We agree with Draghi’s view that deflation risk is “off the table”. The question is how fast (core) inflation can rise further in the current macro environment. In a separate note, we will look at the medium-term outlook for inflation and more specifically, the drivers of the fairly upbeat ECB staff forecasts. The bottom line is that risks to price stability remain tilted to the downside, keeping the pressure on the ECB to respond to any further disappointment in price data. Therefore we see the risks tilted towards more, not less monetary stimulus in H1 2016.


