Summary:
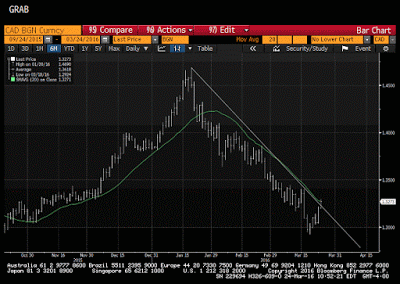
We have been looking for a bottom in the US dollar against the Canadian dollar. It is been difficult, but now it appears that the technicals are turning. This Great Graphic, from Bloomberg, shows that the US dollar is moving above a trend line down off the January 20 high just below CAD1.47. The downtrend line connects the late February high and the mid-March high. It intersects today near CAD1.3200. The 20-day moving average, the green line, also caught the February and mid-March high. It comes in today near CAD1.3200. A close above CAD1.33 would be constructive, but the CAD1.3400-CAD1.3460 area is more important. Oil prices bottomed the same day the greenback peaked against the Canadian dollar. Oil prices put in a high on March 18, the same day the US dollar put in its low against the Canadian dollar. Oil prices. Oil looks heavy and the MACDs have cross lower. A break of .70 basis the May light sweet crude contract would lend credence for the negative near-term outlook. The US premium over Canada for two-year money has moved off the 23 bp low from last month, but near 31 bp now it is still arguably too low to give the greenback much of a lift. However, prospects of a Q2 Fed hike may be helped by a strong employment report next week.
Topics:
Marc Chandler considers the following as important: Canada, Featured, FX Trends, Great Graphic, newsletter
This could be interesting, too:
Nachrichten Ticker - www.finanzen.ch writes Die Performance der Kryptowährungen in KW 9: Das hat sich bei Bitcoin, Ether & Co. getan
Nachrichten Ticker - www.finanzen.ch writes Wer verbirgt sich hinter der Ethereum-Technologie?
Martin Hartmann writes Eine Analyse nach den Lehren von Milton Friedman
Marc Chandler writes March 2025 Monthly
We have been looking for a bottom in the US dollar against the Canadian dollar. It is been difficult, but now it appears that the technicals are turning. This Great Graphic, from Bloomberg, shows that the US dollar is moving above a trend line down off the January 20 high just below CAD1.47.
The downtrend line connects the late February high and the mid-March high. It intersects today near CAD1.3200. The 20-day moving average, the green line, also caught the February and mid-March high. It comes in today near CAD1.3200. A close above CAD1.33 would be constructive, but the CAD1.3400-CAD1.3460 area is more important.
Oil prices bottomed the same day the greenback peaked against the Canadian dollar. Oil prices put in a high on March 18, the same day the US dollar put in its low against the Canadian dollar. Oil prices. Oil looks heavy and the MACDs have cross lower. A break of $37.70 basis the May light sweet crude contract would lend credence for the negative near-term outlook.
The US premium over Canada for two-year money has moved off the 23 bp low from last month, but near 31 bp now it is still arguably too low to give the greenback much of a lift. However, prospects of a Q2 Fed hike may be helped by a strong employment report next week.

