According to a new report from the federal government’s Bureau of Labor Statistics on Friday, the US economy added 272,000 jobs during May while the unemployment rate rose slightly to 4.0 percent. As has been repeatedly the case over the past year, the latest monthly job-growth number was described as a “blowout” or “hot” number by major media outlets like CNN. As is typical in the good-news-is-bad-news view on Wall Street, the Dow fell on Friday out of fear that the “strong” jobs report would impel the Federal Reserve to put off interest-rate cuts further into the future. Clearly, the memo went out from the administration’s supporters that this jobs reports was to be reported as nothing but good news. The Biden White House, for example, released a
Topics:
Ryan McMaken considers the following as important: 6b) Mises.org, Featured, newsletter
This could be interesting, too:
Nachrichten Ticker - www.finanzen.ch writes Die Performance der Kryptowährungen in KW 9: Das hat sich bei Bitcoin, Ether & Co. getan
Nachrichten Ticker - www.finanzen.ch writes Wer verbirgt sich hinter der Ethereum-Technologie?
Martin Hartmann writes Eine Analyse nach den Lehren von Milton Friedman
Marc Chandler writes March 2025 Monthly
According to a new report from the federal government’s Bureau of Labor Statistics on Friday, the US economy added 272,000 jobs during May while the unemployment rate rose slightly to 4.0 percent. As has been repeatedly the case over the past year, the latest monthly job-growth number was described as a “blowout” or “hot” number by major media outlets like CNN. As is typical in the good-news-is-bad-news view on Wall Street, the Dow fell on Friday out of fear that the “strong” jobs report would impel the Federal Reserve to put off interest-rate cuts further into the future.
Clearly, the memo went out from the administration’s supporters that this jobs reports was to be reported as nothing but good news. The Biden White House, for example, released a statement claiming the employment situation is the best the nation has seen in “50 years.” Not surprisingly, The Washington Post soon after reported that the current US job market is “the best...since the 1950s.”
Yet, as we have seen repeatedly over the past year, reporting on monthly jobs reports have focused on a single data point within the report: the establishment survey’s total jobs number. Most reporting on May’s jobs numbers, for example, has ignored the fact that, according to the federal government’s household survey, the number of employed people in America has not increased in eleven months. Moreover, most of the “jobs” added by the establishment survey are due to made-up numbers created through the so-called “birth-death model” which simply assumes into existence hundreds of thousands of jobs created by hypothetical new businesses.
Let’s take a closer look.
Establishment Survey vs. Household Survey
The establishment survey report shows that total jobs—a total that includes both part-time and full-time jobs—increased, month over month, in May by 272,000. The establishment survey measures only total jobs, however, and does not measure the number of employed persons. That means that even when job growth comes mostly from people working multiple part-time jobs, the establishment survey shows big increases while the total number of employed persons does not. In fact, total employed persons can fall while total jobs increases. For May, as total jobs rose, total employed workers fell by 408,000 people.
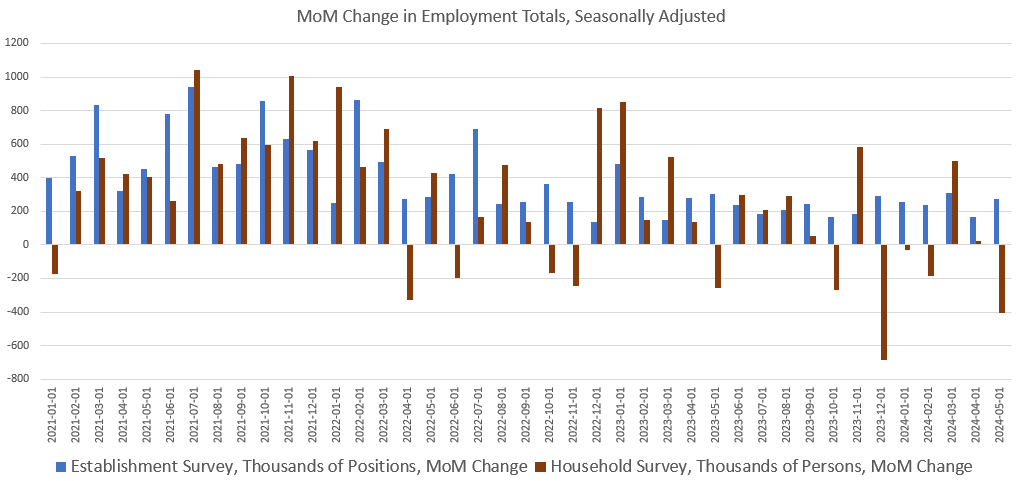
In fact, total household employment was essentially unchanged from the June 2023 level. That is, total employed persons totaled 161,004,000 last June. In May 2024, the total was 161,083,000. Or, put another way, total employment has been flat for nearly a year. Yet, the public keeps hearing month after month that the nation is in the midst of a jobs “blowout.”
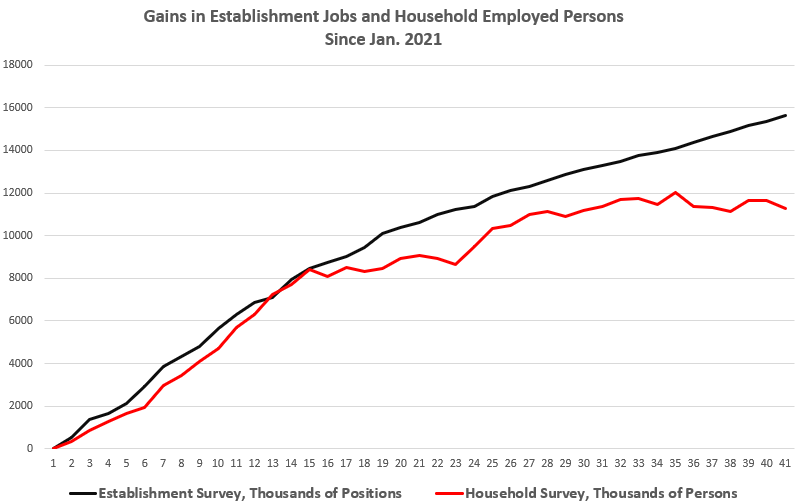
Moreover, if we look at the total increase in both measures over the past three years, we find a gap has opened and persisted over more than two years. Indeed, as of the May report, the gap is at 4.3 million. In other words, since January 2021, the establishment survey has shown 15.6 million new jobs while the household survey has shown only 11.2 million new jobs. And, since there was been virtually no growth in employed persons for a nearly a year, nearly all of that new growth in employed persons occurred before June 2023. The graph of this gap shows how growth in employed persons has flatlined over the past year:
Which survey offers a better picture? Note this comment on Bloomberg’s chief economist Anna Wong on Friday:
May’s jobs report presented contradictory views of the labor market, as we expected. The establishment survey shows robust gains in nonfarm payrolls — yet the unemployment rate rose to 4.0%. We believe the latter currently offers a closer approximation of reality than payrolls...
Assuming that the establishment survey is a realistic picture of the economy at all—an assumption that looks increasingly tenuous—then the current economy is producing many more jobs than actual workers.
A Recession in Full-Time Jobs
In many cases, it is indeed plausible that the economy is adding more jobs than it is adding workers. This can be seen in how the economy is apparently adding far more part-time jobs than it is adding full-time jobs. In fact, the economy is rapidly shedding full-time jobs, and full-time job measures point to recession.
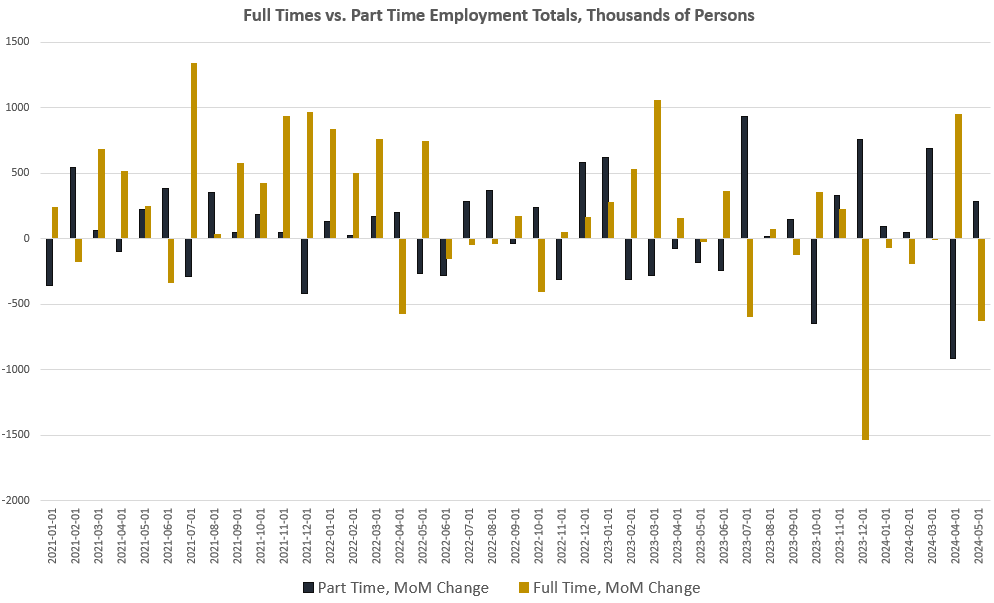
Over the same eleven months that total employed persons has stagnated—and total jobs increased 2.5 million—we find primarily growth in part-time jobs. Over that same eleven months, total part-time jobs increased by 1.7 million. During the same period, full-time jobs fell by more than 1.5 million. Net job creation during that period has been all part-time. In the month of May alone, workers reported a gain of 286,000 part-time positions while full-time jobs well by 626,000. May’s drop in full-time work was the second-largest since the Covid Panic.
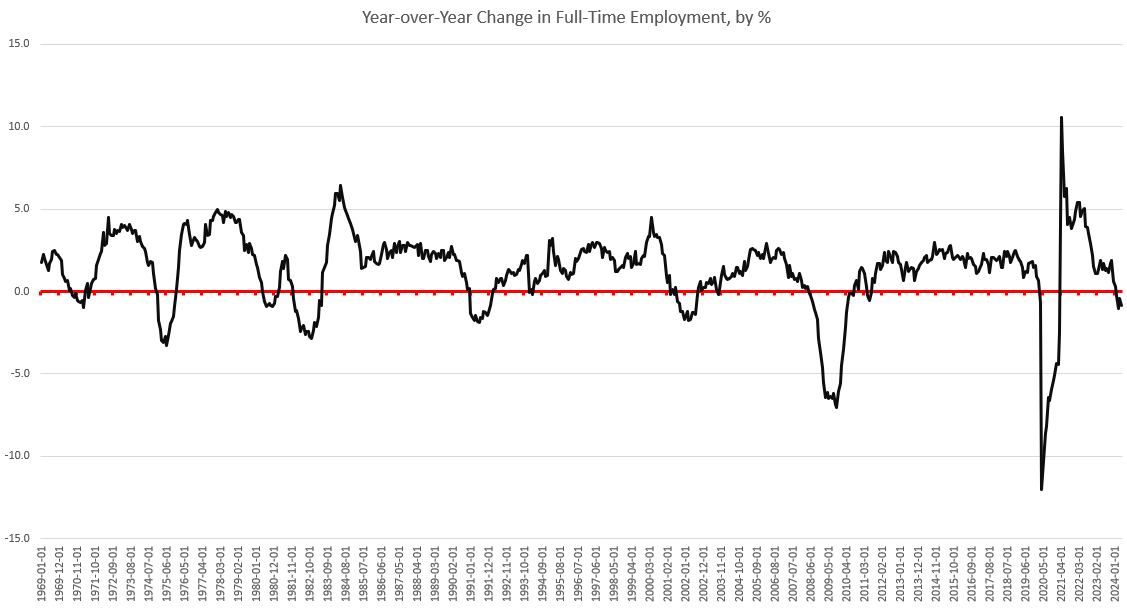
Year over year, total full-time employees fell 0.9 percent. Over the past two months, in fact, the year-over-year measure of full-time jobs has been recession territory. Full-time jobs have now been down, year over year, in February, March, April, and May. Over the past fifty years, three months in a row of negative growth in full-time jobs has always been a recession signal and has occurred when the United States has been in recession, or about to enter a recession:
The full-time jobs indicator now reflects what we’ve seen in temporary jobs for months. For decades, whenever temporary help services are negative, year over year, for more than three months in a row, the US is headed toward recession. This measure has now been negative in the United States for the past nineteen months.
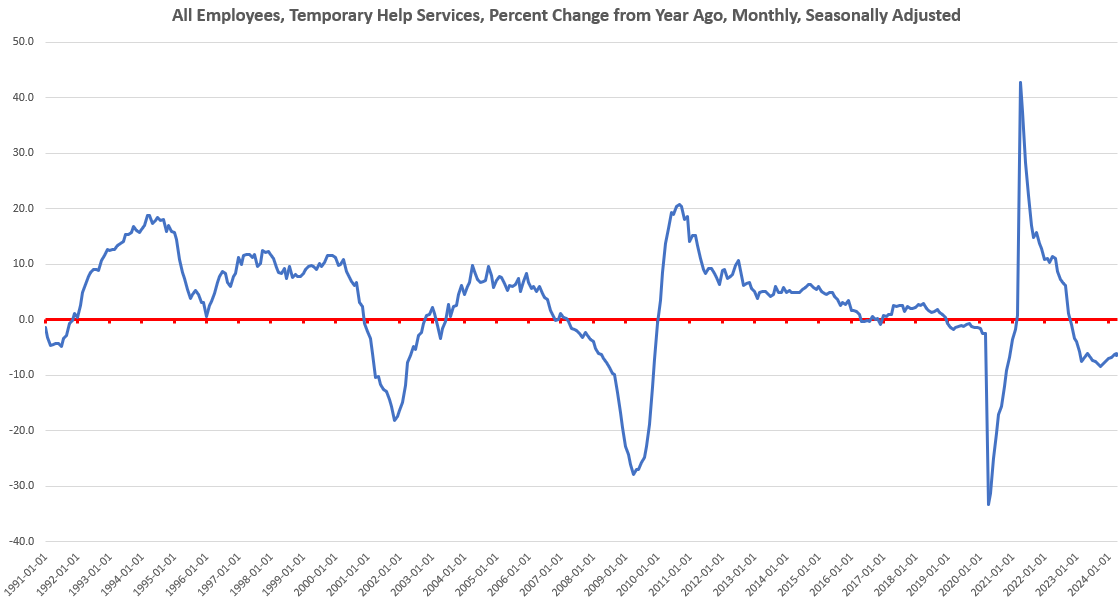
This is to be expected in a weakening economy. Empirical studies have shown that economies tend to shift to part-time work in times of economic downturn as a means of allowing employers more flexibility in reducing costs. This has been observed internationally, and not just in the United States.
If we take a larger look around, we find plenty of worrisome data in the leading indicators: The Philadelphia Fed’s manufacturing index is in recession territory. The same is true of the Richmond Fed’s manufacturing survey. The Conference Board’s Leading Indicators Index continues to point to recession. The yield curve points to recession. Commercial real estate is in big trouble. Net savings turned negative for only the second time in decades in 2023, and has been negative now for four quarters in a row. The economic growth we do see is being fueled by the biggest deficits since covid.
The fact that the “blowout” establishment survey is—as Bloomberg puts it—”Out of Sync With Recent Weaker Economic Data”—may be partly due to the establishment survey’s reliance on the so-called birth-death model. This model is used to estimate how many new jobs were created by new businesses—i..e, “births”—that are missed by the actual survey results. The BLS says it must use “non-sampling methods” to add in these newly created jobs. “Non-sampling methods” means the numbers made up by number crunchers. They don’t show up in any survey. In May, the establishment survey assumed the creation of 231,000 jobs. That’s a sizable number in a report that tells us 271,000 new jobs were created. Wong concludes this very large addition of hypothetical jobs to the establishment total simply doesn’t reflect the real world right now. She writes:
...BLS’ model for estimating business births and deaths – which added 231,000 jobs to the nonfarm-payrolls print in May – is lagging the reality of surging establishment closures and falling business formation. We think the underlying pace of current job gains is likely less than 100,000 per month.
Of course, none of this bothers the corporate-media reporters looking to make the regime look better. Heather McDonald of the Washington Post, for example, insists that the latest “big jobs reports” means “people keep getting jobs.” This is only true, of course, if she means “people keep getting second jobs”—most of which are part-time jobs. Moreover, when we consider the implausibility of the birth-death model, it seems many of those jobs don’t even exist.
Tags: Featured,newsletter
