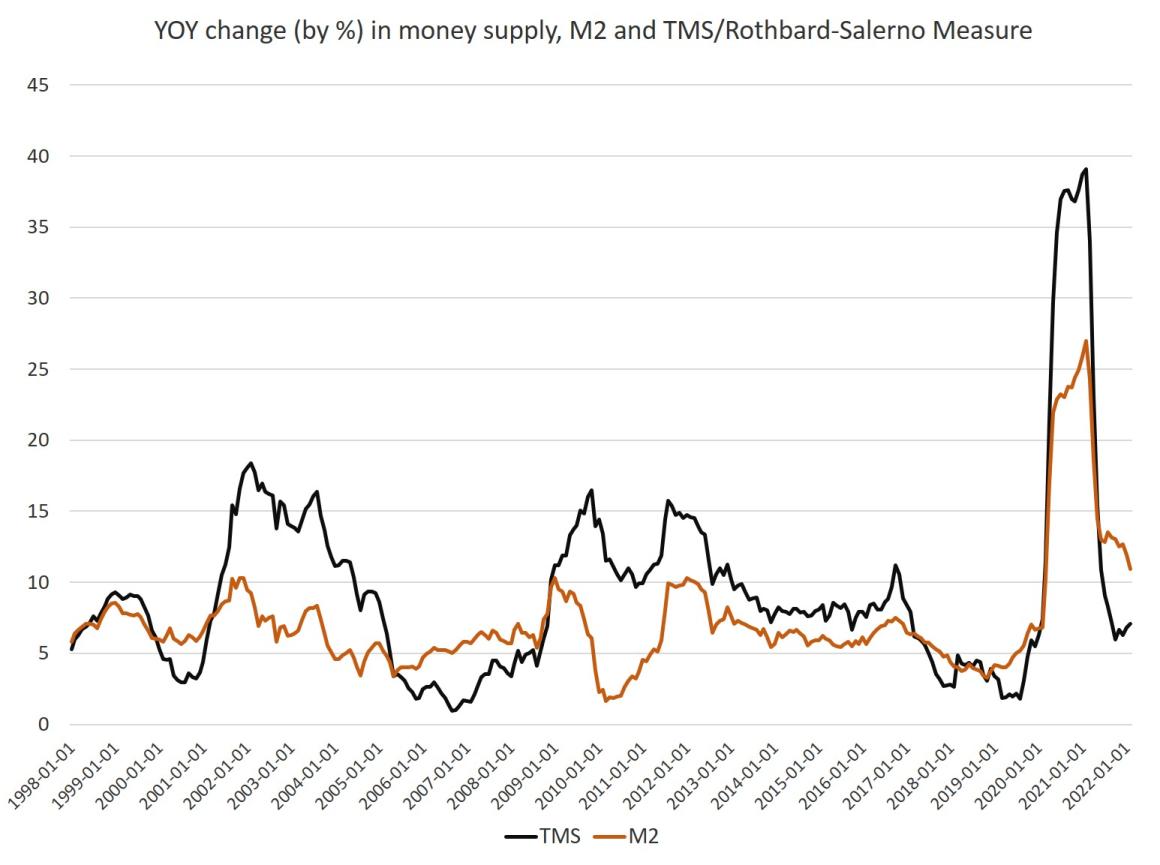
Money supply growth rose for the third month in a row in February, continuing ongoing growth from October’s twenty-one-month low. Even with February’s rise, though, money supply growth remains far below the unprecedented highs experienced during much of the past two years. During thirteen months between April 2020 and April 2021, money supply growth in the United States often climbed above 35 percent, well above even the “high” levels experienced from 2009 to 2013. As money supply growth returns to “normal,” however, this may point to recessionary pressures in the near future. During February 2022, year-over-year (YOY) growth in the money supply was at 7.1 percent. That’s up from January’s rate of 6.8 percent, and down from the February 2021 rate of 39.1 percent.
Topics:
Ryan McMaken considers the following as important: 6b) Mises.org, Featured, newsletter
This could be interesting, too:
Nachrichten Ticker - www.finanzen.ch writes Die Performance der Kryptowährungen in KW 9: Das hat sich bei Bitcoin, Ether & Co. getan
Nachrichten Ticker - www.finanzen.ch writes Wer verbirgt sich hinter der Ethereum-Technologie?
Martin Hartmann writes Eine Analyse nach den Lehren von Milton Friedman
Marc Chandler writes March 2025 Monthly
| Money supply growth rose for the third month in a row in February, continuing ongoing growth from October’s twenty-one-month low. Even with February’s rise, though, money supply growth remains far below the unprecedented highs experienced during much of the past two years. During thirteen months between April 2020 and April 2021, money supply growth in the United States often climbed above 35 percent, well above even the “high” levels experienced from 2009 to 2013. As money supply growth returns to “normal,” however, this may point to recessionary pressures in the near future.
During February 2022, year-over-year (YOY) growth in the money supply was at 7.1 percent. That’s up from January’s rate of 6.8 percent, and down from the February 2021 rate of 39.1 percent. Growth peaked in February 2021. Historically, the growth rates during most of 2020, and through April 2021, were much higher than anything we’d seen during previous cycles, with the 1970s being the only period that comes close. |
|
|
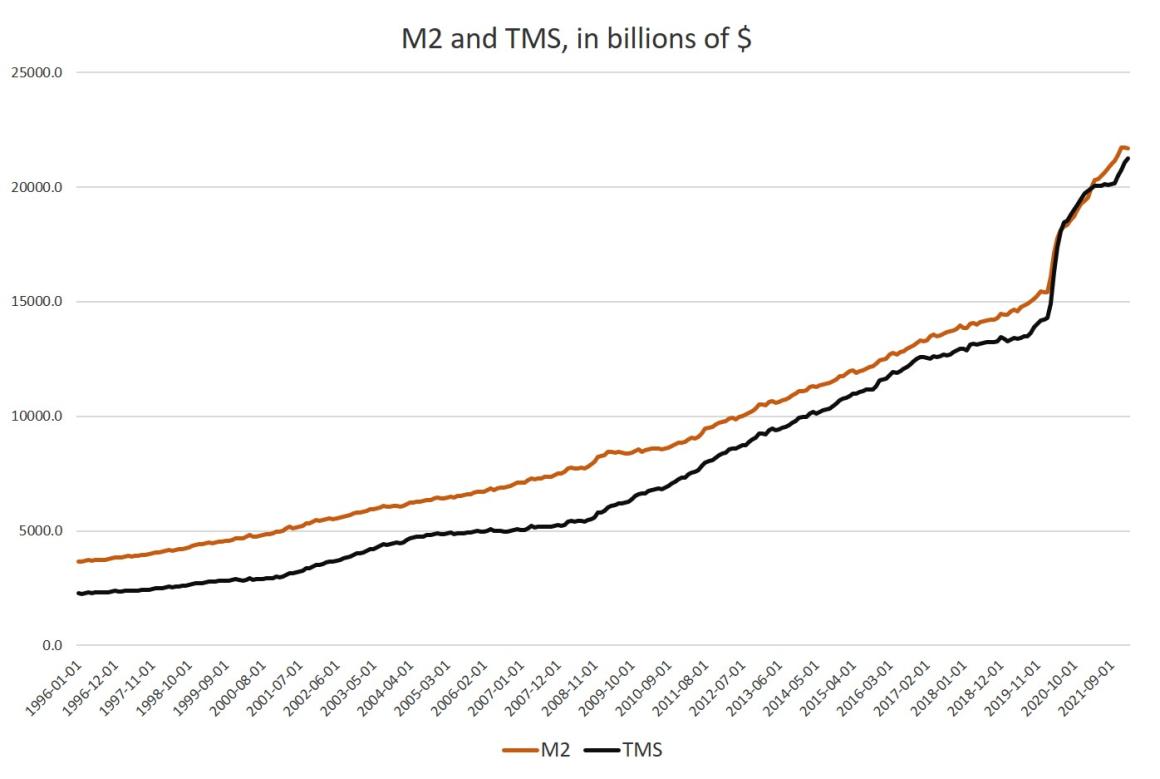
The money supply metric used here—the “true” or Rothbard-Salerno money supply measure (TMS)—is the metric developed by Murray Rothbard and Joseph Salerno, and is designed to provide a better measure of money supply fluctuations than M2. The Mises Institute now offers regular updates on this metric and its growth. This measure of the money supply differs from M2 in that it includes Treasury deposits at the Fed (and excludes short-time deposits and retail money funds). M2 growth rates have been largely stable for the past 11 months, with the growth rate in February falling slightly to 10.9 percent. That’s down from January’s growth rate of 11.9 percent. February’s rate was well down from February 2021’s rate of 26.9 percent. M2 growth peaked during February 2021. Money supply growth can often be a helpful measure of economic activity, and an indicator of coming recessions. During periods of economic boom, money supply tends to grow quickly as commercial banks make more loans. Recessions, on the other hand, tend to be preceded by periods of slowing rates of money supply growth. However, money supply growth tends to begin growing again before the onset of recession. As recession nears, the TMS growth rate typically climbs and becomes larger than the M2 growth rate. This occurred in the early months of the 2002 and the 2009 crises. A similar pattern appeared before the 2020 recession. Money-supply growth fell throughout much of 2019, and the economy appeared headed toward recession. However, the “lockdowns” and stay-at-home orders of the covid panic accelerated this process and ensured a sizable drop in economic activity. Massive stimulus then pushed money-supply growth up to record levels. |
|
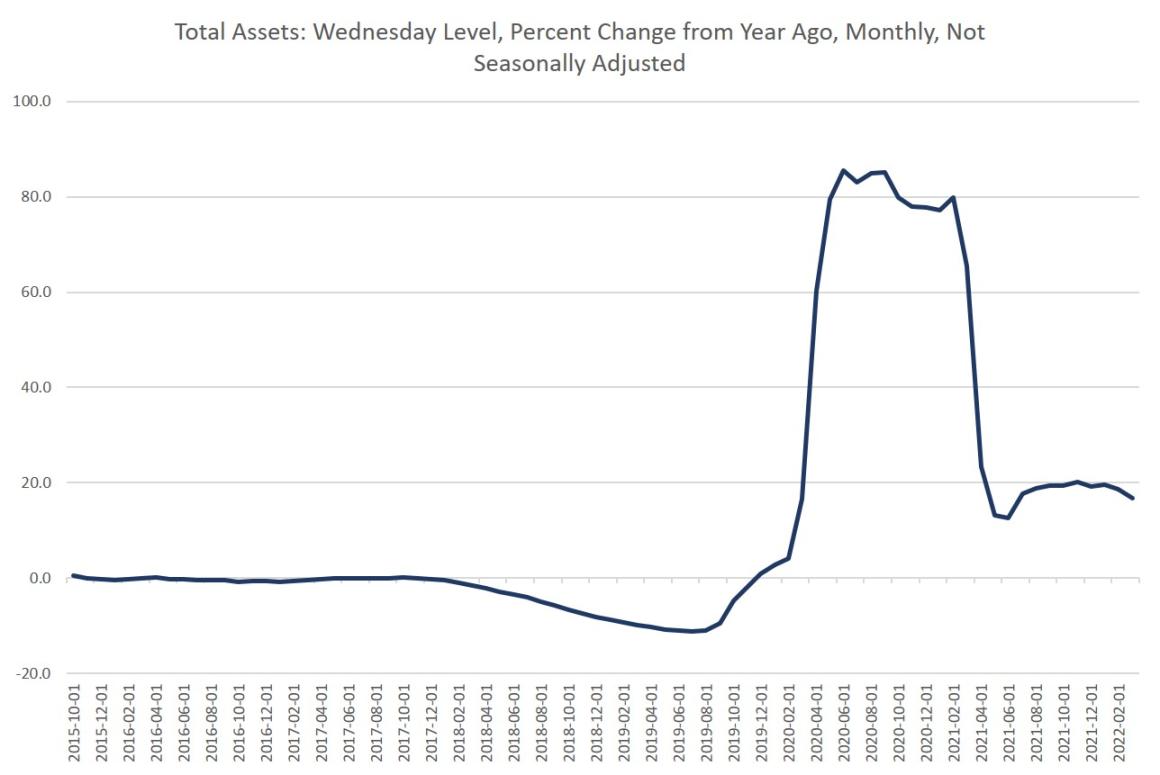
Fed Stimulus and Declining Loan GrowthMoney supply growth was fueled in part by enormous amounts of deficit spending that occurred throughout 2020 and 2021. This led to the “need” for large amounts of monetization by the Federal Reserve. (This was needed to keep interest on the national debt low.) Indeed, as federal deficit spending grew throughout 2020, Fed purchases of government bonds increased substantially as well. Since June 2021, however, federal spending has fallen well below its earlier peaks. This has allowed the Fed to scale back its monthly asset purchases, and the growth in Federal Reserve assets has been slowing—although there are still no plans at the Fed to actually decrease total assets. Just because the Fed has announced the end of QE does not mean Fed assets are decreasing. They remain up, year over year: Moreover, year-over-year growth in commercial loans has been negative, further putting downward pressure on money-supply growth. Commercial and industrial loans in the US were down 2.3 percent year over year in February, and have been in negative territory since April 2021. Much of the talk over economic growth in recent months has focused on employment. The growth in the job market is a positive sign, to be sure, but given that purchasing power has gone negative thanks to inflation, the cost of living is likely to continue going up, mitigating the advantages of employment growth. 30-year fixed mortgages, moreover, have recently hit a 3-year high, and will further impact affordability. |
Tags: Featured,newsletter

