Stretched to the Limit There are good reasons to suspect that the bull market in US equities has been stretched to the limit. These include inter alia: high fundamental valuation levels, as e.g. illustrated by the Shiller P/E ratio (a.k.a. “CAPE”/ cyclically adjusted P/E); rising interest rates; and the maturity of the advance. Near the end of a bull market cycle there is always the question of when a decline will begin, and above all, how large will it be. I believe it possible that the retreat in prices will begin soon and that it could possibly even start out with a crash. I will explain in the following what led me to draw this conclusion. The end of an era – a little review of the mother of modern crash
Topics:
Dimitri Speck considers the following as important: Debt and the Fallacies of Paper Money, Dow Jones, Featured, newslettersent, Nikkei, S&P 500 Large Cap Index, S&P 500 Large Cap Index, The Stock Market
This could be interesting, too:
Nachrichten Ticker - www.finanzen.ch writes Die Performance der Kryptowährungen in KW 9: Das hat sich bei Bitcoin, Ether & Co. getan
Nachrichten Ticker - www.finanzen.ch writes Wer verbirgt sich hinter der Ethereum-Technologie?
Marc Chandler writes March 2025 Monthly
Mark Thornton writes Is Amazon a Union-Busting Leviathan?
Stretched to the LimitThere are good reasons to suspect that the bull market in US equities has been stretched to the limit. These include inter alia: high fundamental valuation levels, as e.g. illustrated by the Shiller P/E ratio (a.k.a. “CAPE”/ cyclically adjusted P/E); rising interest rates; and the maturity of the advance. Near the end of a bull market cycle there is always the question of when a decline will begin, and above all, how large will it be. I believe it possible that the retreat in prices will begin soon and that it could possibly even start out with a crash. I will explain in the following what led me to draw this conclusion. |
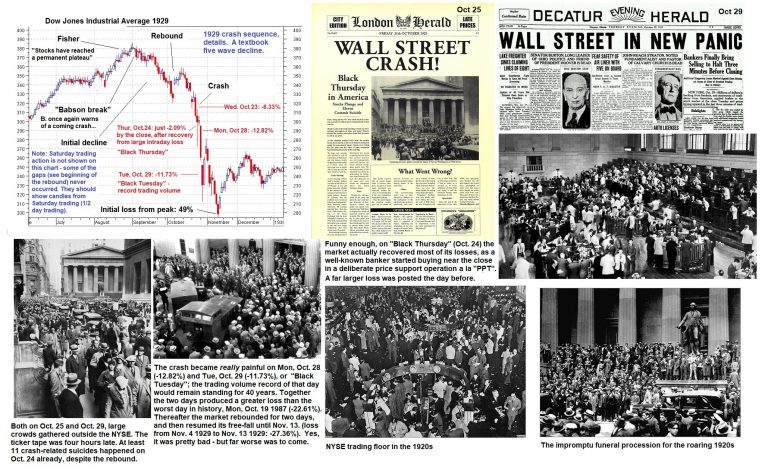 The end of an era – a little review of the mother of modern crash patterns, the 1929 debacle. - Click to enlarge In hindsight it is both a bit scary and sad, in light of the important caesura it represented. In many ways the roaring 20s were the last hurrah of a world in its death throes, a world that never managed to make a comeback. The massive expansion of the State that had begun in the years just before WW1 resumed in full force as soon as the post-war party on Wall Street ended. The worried crowd that formed in the streets around the NYSE in the week of the crash may well have suspected that the starting gun to profound change had just been fired. |
2015 – 2018: the S&P 500 Index Moves Up Along a Well-Defined Trend LineLet us first look at a chart of the S&P 500 Index over the past three years including the major trend line formed by its rally. Prices moved up steadily along this trend line for a long time, until the advance suddenly began to steepen significantly in January of 2018. Thereafter prices plunged very rapidly in early February, followed by a swift rebound. This rebound appears to have ended earlier last week. |
S&P 500 Large Cap Index, Apr 2015 - Mar 2018(see more posts on S&P 500 Large Cap Index, )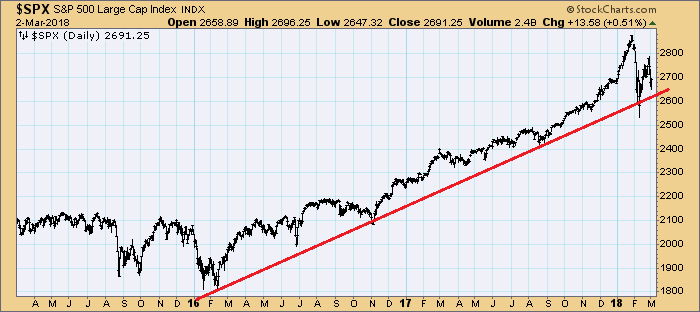 S&P from 2015 to 2018 with trend line providing support: for now the trend line still holds. - Click to enlarge |
In 1987 the Market Crashes after Breaking Through a Similar Trend LineLet us now compare the developments of recent years to a chart showing the move in the DJIA from 1986 to 1987 (focus on the general shape of the move rather than details such as percentage gains and duration). The similarities between the patterns are quite stunning. |
Dow Jones, Apr 1986 - Nov 1987(see more posts on Dow Jones, )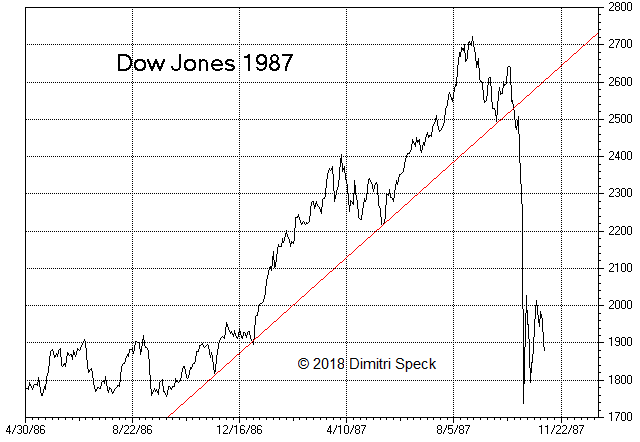 After breaking through the trend line, the index quickly plummeted. - Click to enlarge |
| In 1986/87 prices also moved up along a rising trend line; there was a similar acceleration of the rally into the peak, followed by an initial test of the trend line and a rebound. After a short while the trend line was tested a second time. When it failed to hold, the crash commenced, soon culminating in a loss of almost 23% in a single trading day on October 19 1987. |
 Whiplash… the bull market mascot one week after the initial trend line test. - Click to enlarge |
DJIA in 1929 – The Market also Crashes Right after Breaking a Major Trend LineLet us ponder a chart of the DJIA from 1928 to 1929 as our next example, once again with the major trend line that supported the advance. Once again there are strong similarities to both the current situation and the pattern observed in 1987. Just as happened both in 1987 and very recently, the market rose along the trend line until the rally suddenly accelerated and peaked; this was followed by sharp pullback and a first test of the trend line, a rebound, and eventually a second test that failed and immediately morphed into a crash. A particularly dire bear market ensued in this case – by the summer of 1932, the market had lost almost 90 percent from the early September 1929 top (peak on Sept. 03 1929: 381.17 points; low on July 08 1932: 41.22 points). |
Dow Jones, Jan 1928 - Aug 1929(see more posts on Dow Jones, )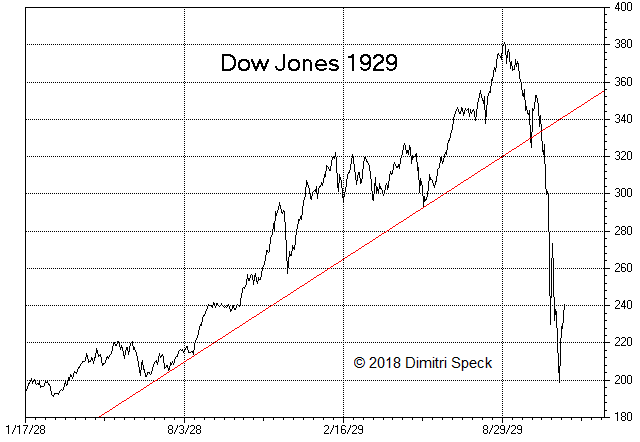 DJIA with support trend line, 1928 – 1929; once again the market crashed right after it tested the trend line that defined the uptrend for a second time and broke through it. - Click to enlarge |
1990 – A Similar Pattern and Trend Line Break Precede the Crash in Japan’s NikkeiWhat about non-US equity markets? One of the biggest bear markets of all time has been underway in Japan since 1990. The next chart shows the Nikkei 225 Index, also including the trend line that served as support in the final years of its bull market advance. Once again prices rose along a well-defined trend line, and once again the rally accelerated into the peak, after which an initial test of the trend line and a rebound followed. On the second test the Nikkei broke through the trend line and a lengthy and severe bear market began. The decline eventually reached a staggering 82% (the low was made in 2009, almost twenty years after the top). |
Nikkei, Jun 1987 - Jul 1990(see more posts on Nikkei, )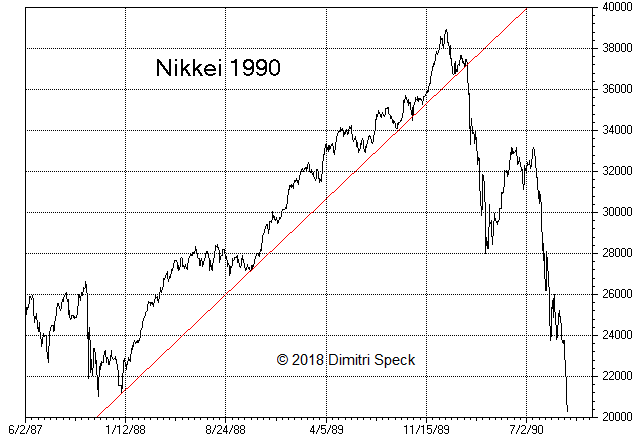 Nikkei 225 with major support trend line, 1987 – 1990; prices decline strongly after the trend line is broken. - Click to enlarge |
When is the Crash Danger Acute?In summary, there are very strong similarities between the chart formation that is in place right now and the patterns that could be observed at the pre-crash peaks of the DJIA in 1929 and 1987 and the Nikkei in 1990. This raises the question whether there are also similarities in the temporal sequence of these patterns. Below is a table that shows the time periods between the most important turning points of the patterns in calendar days after the peak. The line designated “initial trend line test” shows how many days it took to decline from the top to the first test of the trend line. In 1929 it took 30 calendar days, but recently it took just 13 days (peak on January 26 2018, first test completed on February 08). In short, the length of time elapsing between these two turning points was quite different in these cases. The second line designated “peak of rebound” shows the number of days from the top to the peak of the initial retracement rally. In the three historical examples of the US in 1929 and 1987 and in Japan in 1990, it was reached after 37 to 39 calendar days, i.e., these turning points were actually quite close to each other. Currently this would be equivalent to March 02, March 03, or March 06 (at the moment it appears as though the rebound peak may have occurred on February 26. On Feb 27 the market very briefly traded above the range of Feb. 26, but closed lower). The last line, designated “break of the trend line”, shows how many days elapsed from the peak to the second test, when the trend line was broken and the crash wave began. It is interesting that this happened between 45 to 53 calendar days after the respective bull market peaks of the three historical examples. |
Calendar Days after the Peak, 1929 - 2018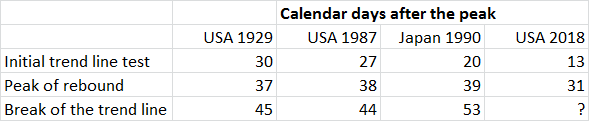 Time periods between major turning points in past crash patterns - Click to enlarge |
| Once again these events happened quite close to each other; the time interval between the top and the failing retest was almost of the same length. Currently the equivalent time interval would target the time period from March 12 to March 20 for the retest.
More important than the precise number of days is the break of the trend line as such though. For instance, in the sharp decline in 1998 no such trend line break occurred, after the benchmark indexes had rallied along similar well-defined uptrend lines for a very long time; the strong advance in prices quickly resumed. |
 Important trend line acrobatics… - Click to enlarge |
The Preconditions for a Crash are in PlaceReaders may well wonder why such strikingly similar price patterns tend to occur at all. There are probably psychological reasons for these similarities. At first prices rise steadily over a lengthy time period, until euphoria (and the “fear of missing out”) lead to an acceleration of the rally, producing a major peak. Such a phase could be observed in January of 2018, when the ratio of bullish to bearish advisors according to Investors Intelligence reached an all time high. What then happens is the opposite of what most investors expect, as prices suddenly decline sharply; initially the pullback tests the trend line successfully. This is what happened in early February this time. By the time the trend line comes into view, sentiment has pivoted completely and has become very bearish, which promptly triggers a rapid rebound. Investors quickly become optimistic again, which paves the way for the decline to resume. In short, expectations are suddenly disappointed at every turn. The subsequent retest of the trend line is the decisive moment though. If it is broken, there is a significant danger that a crash will ensue. Its psychological function is to thoroughly destroy the faith of investors in perennially rising stock prices. Will a crash happen this time as well? Crashes happen only very rarely after all – depending on one’s definition, one could well say that a real crash happens perhaps once every few decades. However, the factors discussed above suggest that crash probabilities must at the very least be regarded as elevated in coming weeks. |
 The beast is ever so slightly bruised, but far from vanquished… - Click to enlarge Crashes are indeed quite rare, and nigh impossible to predict, since sharp run-of-the-mill corrections that don’t end up violating important trend lines cannot be differentiated from those that do ahead of the event. But when a combination of several factors that are known preconditions for crash waves is in evidence, then it is definitely worth to consider the possibility. It is irrelevant that crashes are “normally” rare events. For one thing, they are less rare when the above discussed confluence of price patterns, sentiment and valuations is present; and secondly, if a low probability event harbors very large expected effects, it is definitely a good idea to actually be prepared and have a plan. Why risk ending up as yet another deer in the headlights? The landscape will already be well stocked with those if push actually comes to shove. |
Tags: Dow Jones,Featured,newslettersent,Nikkei,S&P 500 Large Cap Index,The Stock Market