These charts reflect a linear system that is wobbling into the first stages of non-linear destabilization. The widespread presumption is the U.S. is wealthy beyond words, and will remain so as far as the eye can see: wealthy enough to fund trillion-dollar weapons systems, trillion-dollar endless wars, multi-trillion dollar Medicare for all, multi-trillion dollar Universal Basic Income, and so on, in an endless profusion of endless trillions. Just as a thought experiment, let’s ask: how “wealthy” would we be if we stopped borrowing trillions of dollars every year? Or put another way, how “wealthy” would we be if the rest of the world stops buying our trillions in newly issued bonds, mortgages, auto loans, etc.? The
Topics:
Charles Hugh Smith considers the following as important: 5) Global Macro, Featured, newsletter, The United States
This could be interesting, too:
Nachrichten Ticker - www.finanzen.ch writes Die Performance der Kryptowährungen in KW 9: Das hat sich bei Bitcoin, Ether & Co. getan
Nachrichten Ticker - www.finanzen.ch writes Wer verbirgt sich hinter der Ethereum-Technologie?
Martin Hartmann writes Eine Analyse nach den Lehren von Milton Friedman
Marc Chandler writes March 2025 Monthly
These charts reflect a linear system that is wobbling into the first stages of non-linear destabilization.
The widespread presumption is the U.S. is wealthy beyond words, and will remain so as far as the eye can see: wealthy enough to fund trillion-dollar weapons systems, trillion-dollar endless wars, multi-trillion dollar Medicare for all, multi-trillion dollar Universal Basic Income, and so on, in an endless profusion of endless trillions.
Just as a thought experiment, let’s ask: how “wealthy” would we be if we stopped borrowing trillions of dollars every year? Or put another way, how “wealthy” would we be if the rest of the world stops buying our trillions in newly issued bonds, mortgages, auto loans, etc.?
The verboten reality is our “wealth” is nothing but a sand castle of debt. Take away more borrowing and the castle melts away. I’ve gathered a selection of charts that show just how dependent we are on massive debt expansion that continues essentially forever, as any pause in debt expansion will collapse the entire system.
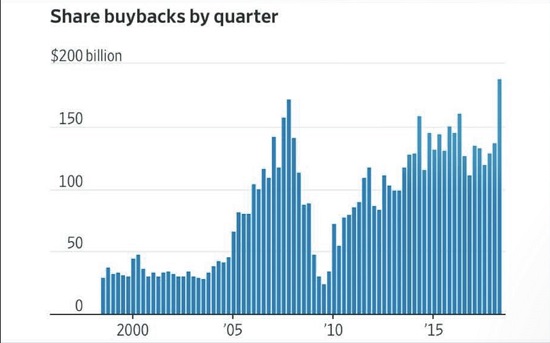
Corporate buybacks have powered rising corporate earnings–and the buybacks are funded by debt. Corporate debt has exploded higher in the past decade, enabling stock buybacks on an unprecedented scale.
Government debt–federal, state and local– is rising an exponential rates.We’re not paying for more government programs with earnings–we’re simply borrowing trillions and hoping we can borrow the interest payments that will also rise along with the debt.
Household debt, student loans, auto loans–all are soaring. The corporate sector, government and the household sector–all are living on borrowed money, and relying on magical thinking to mask the inevitable consequences.
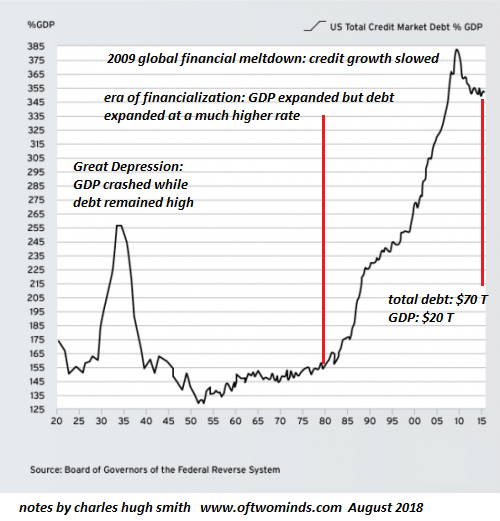
| Here’s debt to GDP. Yes, the economy expanded, but debt expanded much faster. Every additional dollar of GDP now requires multiple dollars of new debt. |
US Total Credit Market Debt |
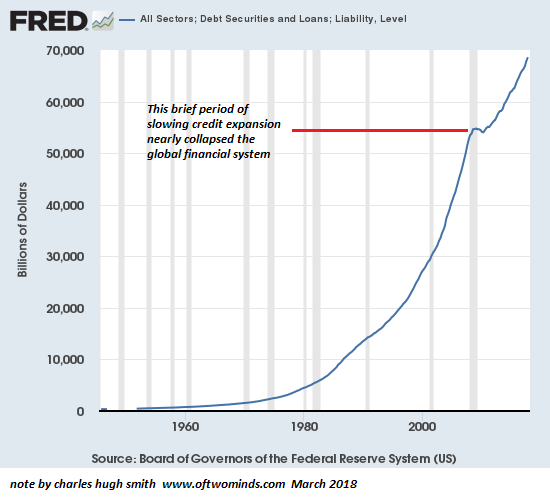
| The tiny pause in borrowing circa 2008-09 almost collapsed the global financial system. If this is your idea of a stable, sustainable trajectory, what are you high on? |
Debt Securities and Loans and Liability Level, 1960 - 2018 |
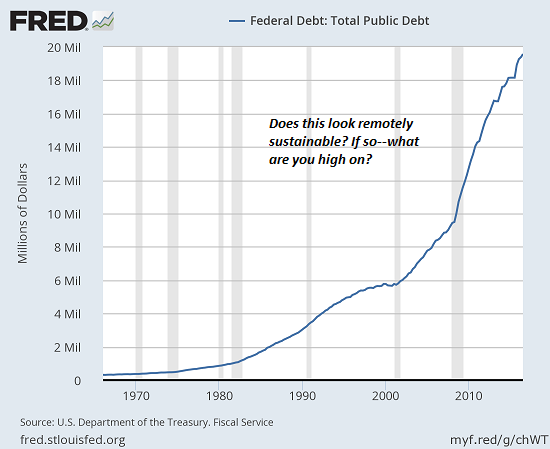
| This chart of federal debt is outdated— federal debt has far exceeded $20 trillion. A trillion here and a trillion there, pretty soon you’re talking debt levels that insure a devaluation of the currency or a collapse of the entire-debt-dependent system. |
Total Public Debt, 1970 - 2018 |
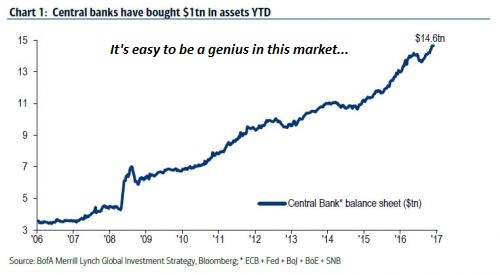
| Before we get all giddy about the soaring stock market, let’s remember what’s been driving it higher–central banks creating trillions out of thin air and using the “free money” to buy stocks and bonds. |
Central Banks Purchases |
| Corporations have been gorging on low-cost debt to fund stock buybacks, which push share prices higher, rewarding insiders and the already-wealthy who own the majority of financial assets. |
Stock Buybacks, 2000 - 2018 |
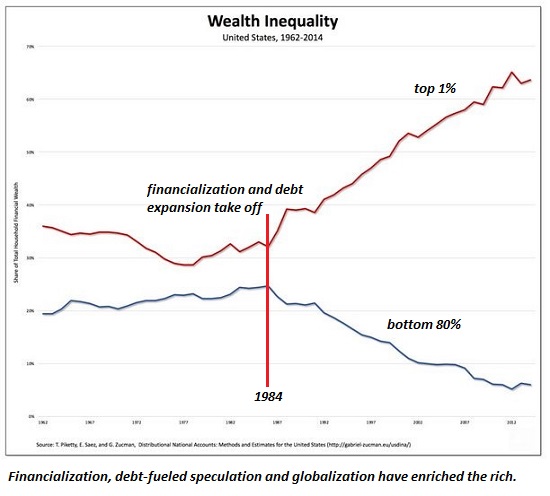
| Speaking of insanely destabilizing and unsustainable trajectories–take a look at wealth inequality: the top 1% (actually, the top .5%) have skimmed the vast majority of the past decade’s gains, the top 5% have gathered most of the remaining crumbs, the next 15% (between 80% and 95%) have illusory gains solely based on bubble valuations, and the bottom 80% have lost ground. |
Wealth Inequality |
Anyone who thinks exponentially rising debt and staggering wealth/income inequality are stable and sustainable is taking way too much Ibogaine. Magical thinking doesn’t actually change reality or make the unsustainable sustainable.
These charts reflect a linear system that is wobbling into the first stages of non-linear destabilization. What is unsustainable and unstable will destabilize, slowly at first, and then rapidly as all the buffers creating the illusion of stability give way.
Our “wealth” is as illusory as the fantasy that ever-expanding trillions of dollars can be borrowed annually for decades to come, with no consequence.
The system collapses if we trim borrowing, and it collapses if we keep borrowing more every year. There is no middle ground, no Goldilocks state where we can borrow just enough to squeak by. That appears possible in a linear system, but once it shifts into non-linear dynamics, that fantasy will quickly be destroyed.
Tags: Featured,newsletter

