USD/CHF extends gradual declines from the monthly top marked the last-Monday. A descending trend line support, 61.8% Fibonacci retracement may offer intermediate rests during the downside. 0.9745/50 can act as a buffer resistance beyond 100-HMA. USD/CHF remains under pressure while taking rounds to 0.9655, down 0.05% on a daily, amid the early trading session on Monday. The pair currently tests 50% Fibonacci retracement of its upside from March 27 to April 06. However, a descending trend line from last-Monday, at 0.9685, followed by a 100-HMA level of 0.9693, restricts the pair’s recovery moves. Should there be a clear upside past-0.9693, the pair can cross 0.9700 mark to aim for 0.9745/50 area comprising multiple lows/highs marked during early-April. Meanwhile, a
Topics:
Anil Panchal considers the following as important: 1.) FXStreet on SNB&CHF, 1) SNB and CHF, Featured, newsletter
This could be interesting, too:
Nachrichten Ticker - www.finanzen.ch writes Die Performance der Kryptowährungen in KW 9: Das hat sich bei Bitcoin, Ether & Co. getan
Nachrichten Ticker - www.finanzen.ch writes Wer verbirgt sich hinter der Ethereum-Technologie?
Martin Hartmann writes Eine Analyse nach den Lehren von Milton Friedman
Marc Chandler writes March 2025 Monthly
- USD/CHF extends gradual declines from the monthly top marked the last-Monday.
- A descending trend line support, 61.8% Fibonacci retracement may offer intermediate rests during the downside.
- 0.9745/50 can act as a buffer resistance beyond 100-HMA.
| USD/CHF remains under pressure while taking rounds to 0.9655, down 0.05% on a daily, amid the early trading session on Monday.
The pair currently tests 50% Fibonacci retracement of its upside from March 27 to April 06. However, a descending trend line from last-Monday, at 0.9685, followed by a 100-HMA level of 0.9693, restricts the pair’s recovery moves. Should there be a clear upside past-0.9693, the pair can cross 0.9700 mark to aim for 0.9745/50 area comprising multiple lows/highs marked during early-April. Meanwhile, a downward sloping trend line from April 03, around 0.9620 now, can restrict the pair’s immediate declines ahead of 61.8% Fibonacci retracement level of 0.9615. It’s worth mentioning that the pair’s declines below 0.9615 will need validation from 0.9600 round-figure before targeting 0.9550 and March 29 low near 0.9500. |
USD/CHF hourly chart(see more posts on USD/CHF, )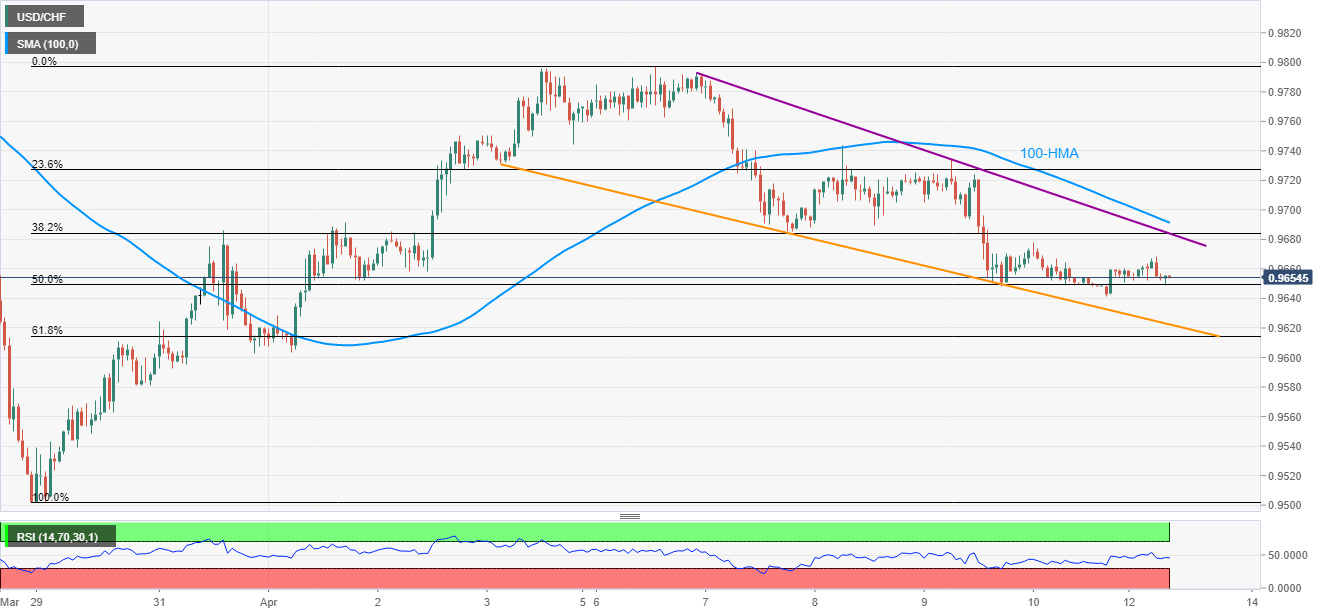 - Click to enlarge |
Trend: Bearish
You Might Also Like
 USD/CHF Asia Price Forecast: Greenback holds above 0.9700 vs. Swiss franc
USD/CHF’s bull trend remains intact as the spot holds above the 0.9700 figure. The level to beat for bulls is the 0.9800 resistance. USD/CHF is trading below the 100 and 200 SMA on the daily chart as the market is consolidating the last leg up.
 USD/CHF Price Analysis: Depressed below monthly rising trendline, 50-day SMA
USD/CHF remains on the back foot after breaking near-term key supports, Good Friday holiday restricts the moves. Late-March lows, 61.8% Fibonacci retracement on sellers’ radars. 200-day SMA adds to the resistance beyond the latest ones.
 Negativzinsen verursachen steigende Hypo-Zinsen – erst Recht zur „Corona-Unzeit“
„Ich glaube, dass einige Kommentatoren die Strenge der eingeführten Massnahmen (Einführung der Negativzinsen, Anmerkung des Autors) noch nicht ganz begriffen haben (…).“
 FINMA veröffentlicht weitere Aufsichtsmitteilung im Kontext der COVID-19-Krise
Die Eidgenössische Finanzmarktaufsicht FINMA veröffentlicht eine zweite Aufsichtsmitteilung mit Hinweisen für die Beaufsichtigten zu Erleichterungen und Präzisierungen der Aufsichtspraxis im Kontext der COVID-19-Krise.
 FINMA begrüsst Dividenden-Schritt der Grossbanken
Die Eidgenössische Finanzmarktaufsicht FINMA begrüsst den heute von der UBS Group AG und der Credit Suisse Group AG angekündigten Schritt, trotz deren Position der Kapitalstärke jeweils die Hälfte der geplanten Dividendenausschüttung für das Jahr 2019 zu verschieben.
 Fragile, Not Fortified
On Sunday, Argentina’s government announced it was postponing payment on any domestically-issued debt instruments denominated in foreign currencies. That means dollars, just not Eurobonds. At least not yet. In response, ratings agencies such as Fitch declared the maneuver a distressed debt exchange.In other words, technically a default.
 Nothing Is What It Seems
My latest interview about Corona, Liberty, Private Property, Authoritarism, and a fear-mongering global media campaign, which I call borderline criminal
[embedded content]
 New debt relief measures on the horizon for struggling firms
The Swiss government is examining plans to stave off bankruptcies of companies struggling with the fallout of the coronavirus crisis. But regular debt collection procedures will resume on April 20. Justice Minster Karin Keller-Sutter said the aim was to stabilise the economy and to secure jobs.
Tags: Featured,newsletter