Pater Tenebrarum
My articles My siteAbout meMy booksMy videos
Follow on:TwitterFacebook
Seeking Alpha
Rydex Ratios Go Bonkers, Bears Are Dying Off For many years we have heard that the poor polar bears were in danger of dying out due to global warming. A fake photograph of one of the magnificent creatures drifting aimlessly in the ocean on a break-away ice floe was reproduced thousands of times all over the internet. In the meantime it has turned out that polar bears are doing so well, they are considered a quite dangerous plague in some regions in Alaska. Alas, there is one species of bear that really is in danger of going extinct – only this one lives on Wall Street, or let us rather say, it vegetates on Wall Street these days. Similar levels of complacency as were evident in the AAII data were reflected in
Topics:
Pater Tenebrarum considers the following as important: Chart Update, Debt and the Fallacies of Paper Money, Featured, newsletter, The Stock Market
This could be interesting, too:
Nachrichten Ticker - www.finanzen.ch writes Die Performance der Kryptowährungen in KW 9: Das hat sich bei Bitcoin, Ether & Co. getan
Nachrichten Ticker - www.finanzen.ch writes Wer verbirgt sich hinter der Ethereum-Technologie?
Martin Hartmann writes Eine Analyse nach den Lehren von Milton Friedman
Marc Chandler writes March 2025 Monthly
Rydex Ratios Go Bonkers, Bears Are Dying OffFor many years we have heard that the poor polar bears were in danger of dying out due to global warming. A fake photograph of one of the magnificent creatures drifting aimlessly in the ocean on a break-away ice floe was reproduced thousands of times all over the internet. In the meantime it has turned out that polar bears are doing so well, they are considered a quite dangerous plague in some regions in Alaska. Alas, there is one species of bear that really is in danger of going extinct – only this one lives on Wall Street, or let us rather say, it vegetates on Wall Street these days. Similar levels of complacency as were evident in the AAII data were reflected in Rydex ratios, which streaked to fresh extremes in recent weeks. The bull/bear asset ratio reached an astonishing new all time high of nearly 36 at one point (i.e., bullish assets were 36 times larger than bearish assets), with bear assets crumbling to a new record low. The leveraged Rydex ratio streaked to a new all time high of 18.70 right at the turn of the year (note: from 2001 to 2012 a leveraged ratio above 2 was actually considered “extreme”). |
Rydex Bull/Bear Asset Ratio and Total Bear Assets, 2003 - 2018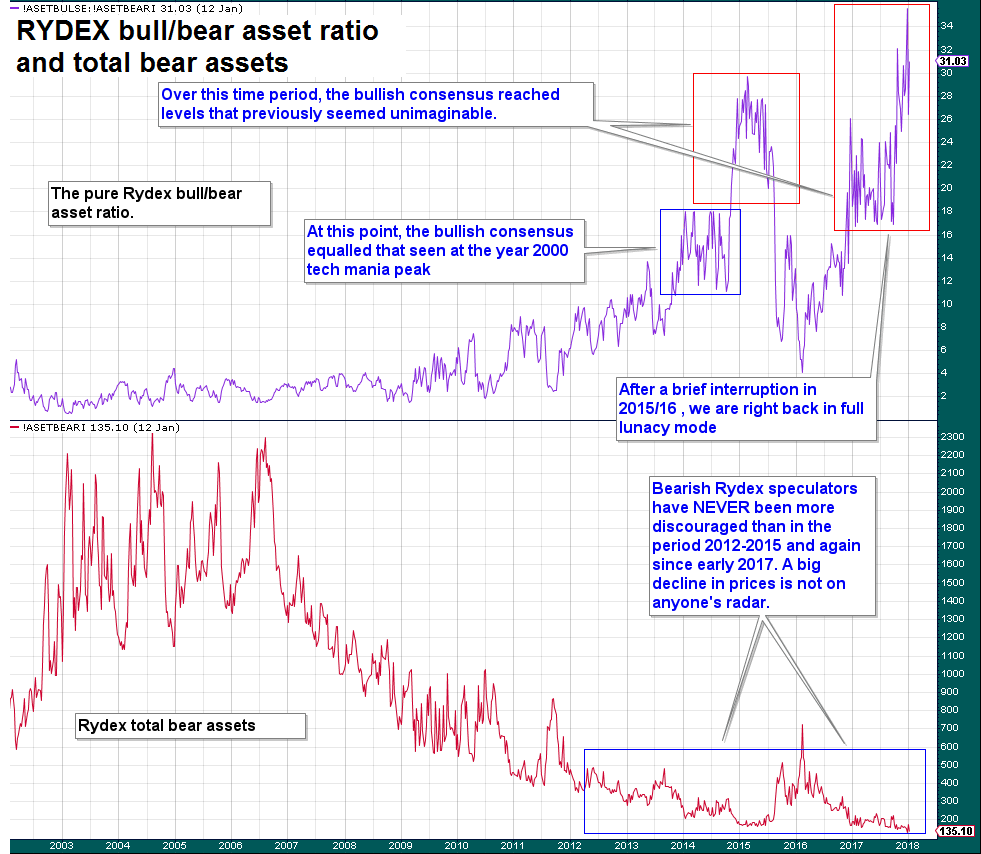 The pure Rydex bull/bear ratio and total Rydex bear assets. - Click to enlarge We have left our annotations unchanged since the last time we showed this chart, since we have nothing new to add to this. What is new is only that the ratio actually surged to 36 – which was more than double the level it hit at the peak of the tech mania in February/March 2000. That is quite incredible. |
| The new record high in the leveraged Rydex ratio was set on December 29. Since then its volatility has increased quite a bit. A bout of what traders must have thought of as timely profit-taking at the beginning of the year was quickly replaced by regret and an immediate rush back into leveraged long funds – at higher prices. |
Rydex Total Leveraged Bull/Bear Ratio, Apr 2015 - Jan 2018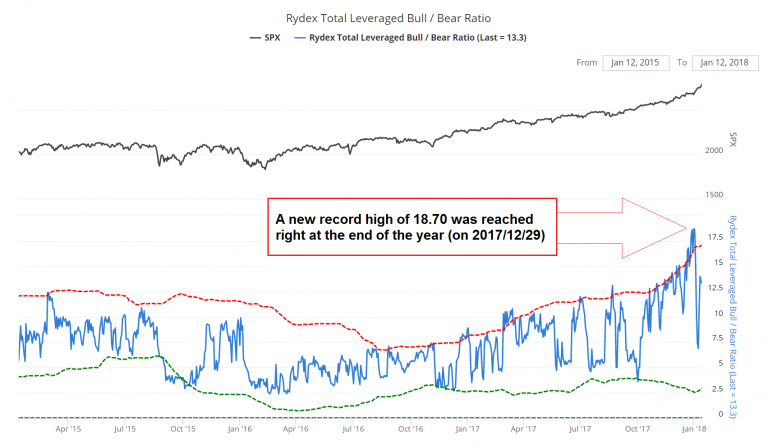 Spicing it up with leverage: the ratio between leveraged bull and bear Rydex assets streaked to a new all time high at the end of the year, followed by a volatile sequence comprising a sharp decline and an immediate bounce-back. - Click to enlarge The low that was put in on occasion of this brief profit-taking interlude was at a level 3 times higher than the level considered “extremely high” in the time period 2001 – 2012. |
Ursus DejectusDoes the much larger ETF universe confirm what we see in the Rydex funds and reflect a similar extent of despondency among short sellers? It certainly appears as though stock market bears have given up on a broad front. Short positions in major ETFs have crumbled as well – SPY is particularly noteworthy in this context, as there are almost no shorts left in it at all. By contrast, in 2008 more than 30% of the ETF’s outstanding shares were sold short at one point. |
S&P 500 ETF Trust Short Interest, 2007 - 2017 Bears on the run – recently SPY shorts as a percentage of outstanding shares briefly fell to precisely zero. - Click to enlarge Once again, this situation cannot possibly get more extreme. There really is a zero bound in this case. |
| A long term chart of Rydex bear assets shows how extensive the wipe-out of bearish positions actually was. From their peak in early 2003, they have declined more than 95%. Even at the previous cycle low in bear assets, which was put in a few months after the peak of the tech mania in 2000, bear assets were more than 3 times higher than at the recent low (this is a bit hard to see on a linear chart, but at the time they actually stood at $317 million vs. $103 million today). Obviously, we regard the only slightly higher interim low of 2015 as part of the current market cycle. |
Rydex Total Bear Assets, 2002 - 2018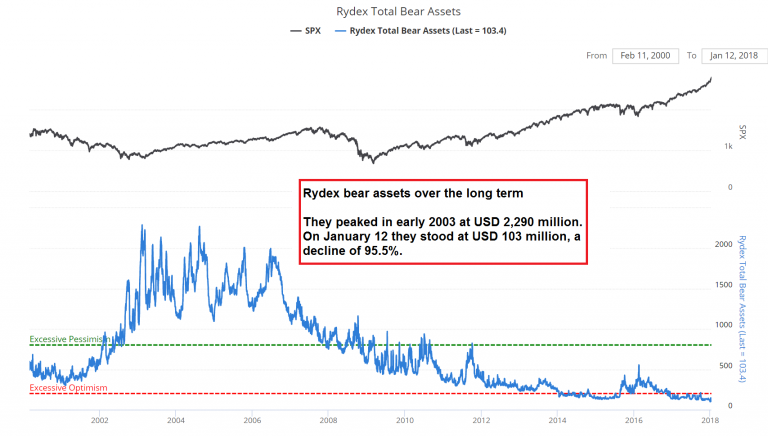 Rydex bear assets over the long term: down 95.5% from the peak made 15 years ago and down ~66% from the previous major cycle low in late 2000. - Click to enlarge |
ConclusionWe realize of course that many other technical indicators are not providing major warning signals just yet. Moreover, many sentiment and positioning data have moved from extreme to extreme for quite some time and have proved to be rather poor predictors of the market’s trend – in fact, recently they were not even much use in forecasting short term corrections (as there were none since early 2016). Having said that, over the past several weeks most of these data have reached such outstanding readings that we would at the very least expect to see a shake-out of some sort fairly soon, even if the market’s ultimate peak is yet to come. Note that the volatility index VIX, which measures the volatility premiums of front-month SPX options, is no longer declining. After dipping below the level of 9 a few times, it has actually turned up and increased in recent days in the face of a continuing rally. This may well represent a short term warning sign. |
Volatility Index, March 2017 - Jan 2018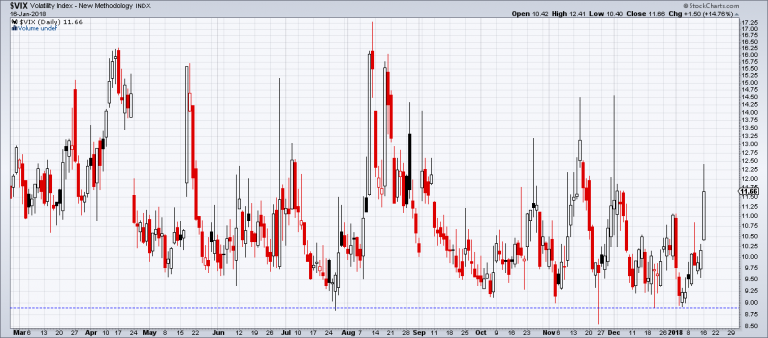 The VIX apparently doesn’t want to decline below 9, aside from intraday dips. Its recent surge is slightly incongruent – and a possible red flag. - Click to enlarge |
Tags: Chart Update,Featured,newsletter,The Stock Market