Pater Tenebrarum
My articles My siteAbout meMy booksMy videos
Follow on:TwitterFacebook
Seeking Alpha
A Warning Signal from Market Internals Readers may recall that we looked at various market internals after the sudden sell-offs in August 2015 and January 2016 in order to find out if any of them had provided clear advance warning. One that did so was the SPX new highs/new lows percent index (HLP). Below is the latest update of this indicator. S&P 500 New High Lows Percent, Feb 2015 - Apr 2018(see more posts on S&P 500, )HLP (uppermost panel) provided advance warning prior to the sell-offs of August 2015 and January 2016 by dipping noticeably below the zero line shortly before the selling started. - Click to enlarge They briefly returned to positive territory after the first dip, and after a third or fourth
Topics:
Pater Tenebrarum considers the following as important: Credit Markets, Debt and the Fallacies of Paper Money, Featured, newsletter, On Economy
This could be interesting, too:
Nachrichten Ticker - www.finanzen.ch writes Die Performance der Kryptowährungen in KW 9: Das hat sich bei Bitcoin, Ether & Co. getan
Nachrichten Ticker - www.finanzen.ch writes Wer verbirgt sich hinter der Ethereum-Technologie?
Martin Hartmann writes Eine Analyse nach den Lehren von Milton Friedman
Marc Chandler writes March 2025 Monthly
A Warning Signal from Market InternalsReaders may recall that we looked at various market internals after the sudden sell-offs in August 2015 and January 2016 in order to find out if any of them had provided clear advance warning. One that did so was the SPX new highs/new lows percent index (HLP). Below is the latest update of this indicator. |
S&P 500 New High Lows Percent, Feb 2015 - Apr 2018(see more posts on S&P 500, )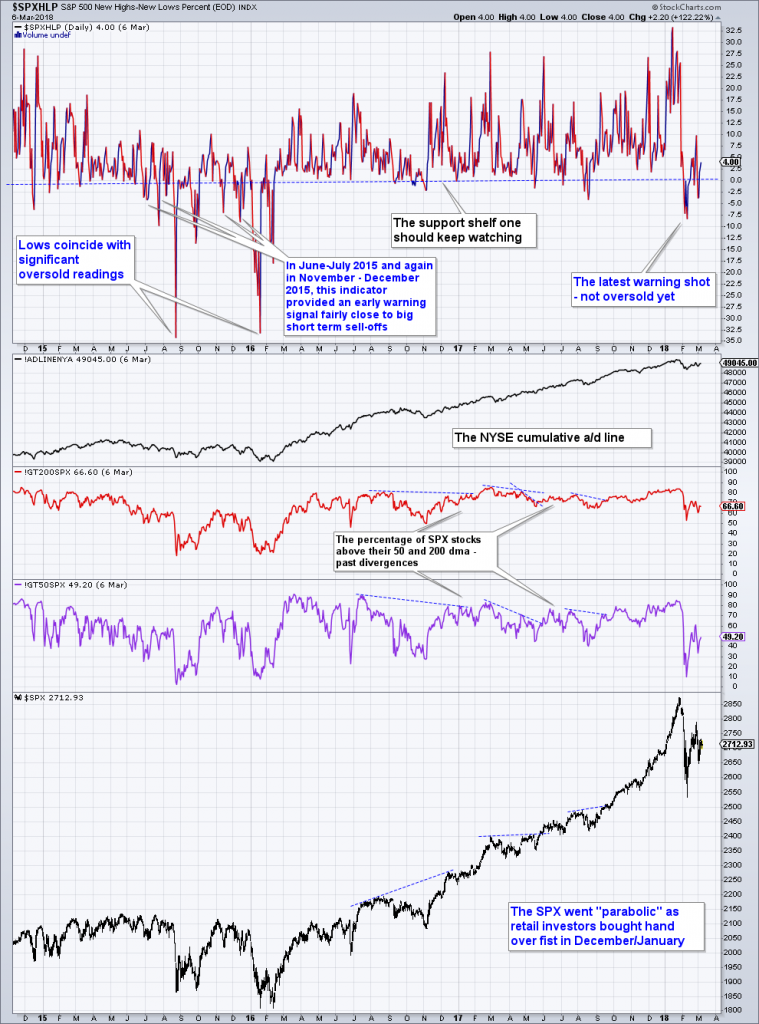 HLP (uppermost panel) provided advance warning prior to the sell-offs of August 2015 and January 2016 by dipping noticeably below the zero line shortly before the selling started. - Click to enlarge They briefly returned to positive territory after the first dip, and after a third or fourth dip in close succession the sell-off commenced. What is currently of interest to us is that the sell-offs themselves generated deeply oversold readings in HLP in excess of -30. Only then did the market bottom and reverse back up. This is interesting because the early February sell-off has only managed to generate a warning signal so far. We have seen two dips below the zero boundary since then, but an oversold reading has not been generated yet. Based on this indicator, we are now merely in the phase prior to the actual sell-off. Looking at the third and fourth panels from the top, note that while the percentage of stocks below the 50-dma (purple line) did reach comparable “oversold levels” in February, the percentage of stocks below the 200 dma (red line) did not. Currently both percentages are almost at the same level they inhabited just before the August 2015 sell-off. |
A Mitigating FactorShort term traders should keep an eye on the Russell 2000 Index. In recent trading days, relative strength in this index (which contrasts with its persistent relative weakness prior to the February sell-off) invariably presaged intraday rebounds in the other major indexes after they initially sold off on negative news-flow (mainly in connection with the president becoming more active with his protectionist agenda). We don’t know for how long this information will remain useful or exploitable, but it is obviously useful at the moment. Since it represents a positive factor supporting the market, it mitigates the HLP warning signal discussed above. Note in this context that relative weakness in the Russell 2000 over a span of several weeks preceded the August 2015 sell-off as well, just as it preceded the recent sell-off in February. In other words, this indicator is normally of medium term significance (at least from the point of view of a short-term oriented trader), this is to say, it gives advance warnings of coming bouts of strength or weakness in the broader market over periods of several weeks and months. Currently it exerts a decidedly short term effect. One question is of course why the RUT is suddenly changing course again. There seems to be no rhyme or reason to these moves. We thought that perhaps the behavior of XME (the base metals ETF), provided a clue, as it is suddenly also exhibiting relative strength. Steel stocks have an unusually large weight among the constituents of XME. Moreover, most of them are small caps these days, as the remnants of the US steel industry are quite small in comparison to the higher value-adding industries that have taken its place. News of the planned introduction of steel tariffs has given these stocks a boost, but that doesn’t really explain why the broader RUT is suddenly seen as attractive (the steel sector actually doesn’t have a particularly large weight in the index). After all, there are far more users than producers of steel in the US, so the manufacturing sector at large is actually subsidizing steel producers now. Most likely this type of rotation is simply based on money sloshing about blindly in search of “relative value”. Whatever the reason, it is happening at present and strength in the RUT has as a rule almost always coincided with strength in the rest of the market. Given that the action makes no sense, it may not last very long, but that remains to be seen. Note also that second in line in terms of short term relative strength is the Nasdaq, which is lending support to the other benchmark indexes as well. |
S&P 500 Large Cap Index and RUT Daily, Feb 2017 - Mar 2018(see more posts on S&P 500, )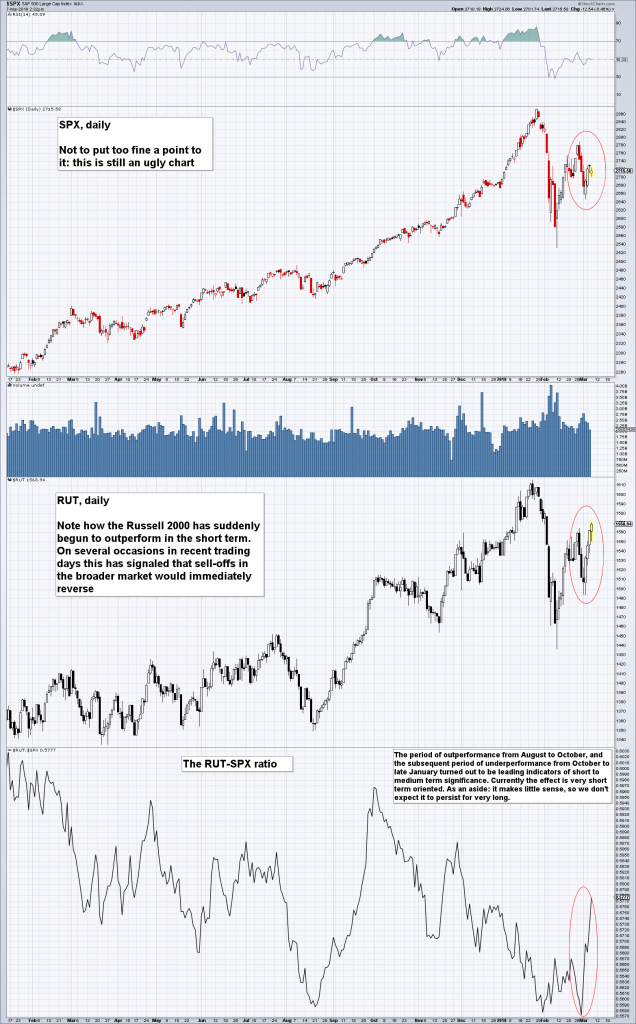 - Click to enlarge Currently the RUT is once again displaying noticeable relative strength in the short term, which has had quite an effect on the broader market so far, as several intraday selling squalls recently ended with the market quickly recovering its losses. |
Conclusion
As long as relative strength in the RUT and the Nasdaq persists, the market will probably not weaken substantially. The question is how long-lived this phenomenon will be – we will just have to wait and see. At the same time, the HLP-related warning signal remains active as well.
In our opinion it would become an acute warning signal if the mitigating influence of relative strength in the RUT and Nasdaq indexes abates in the near future and HLP dips into negative territory again. In that case we would have every reason to expect that the HLP index will move to “oversold” status, which would presumably be associated with quite a sizable decline.
Tags: Credit Markets,Featured,newsletter,On Economy