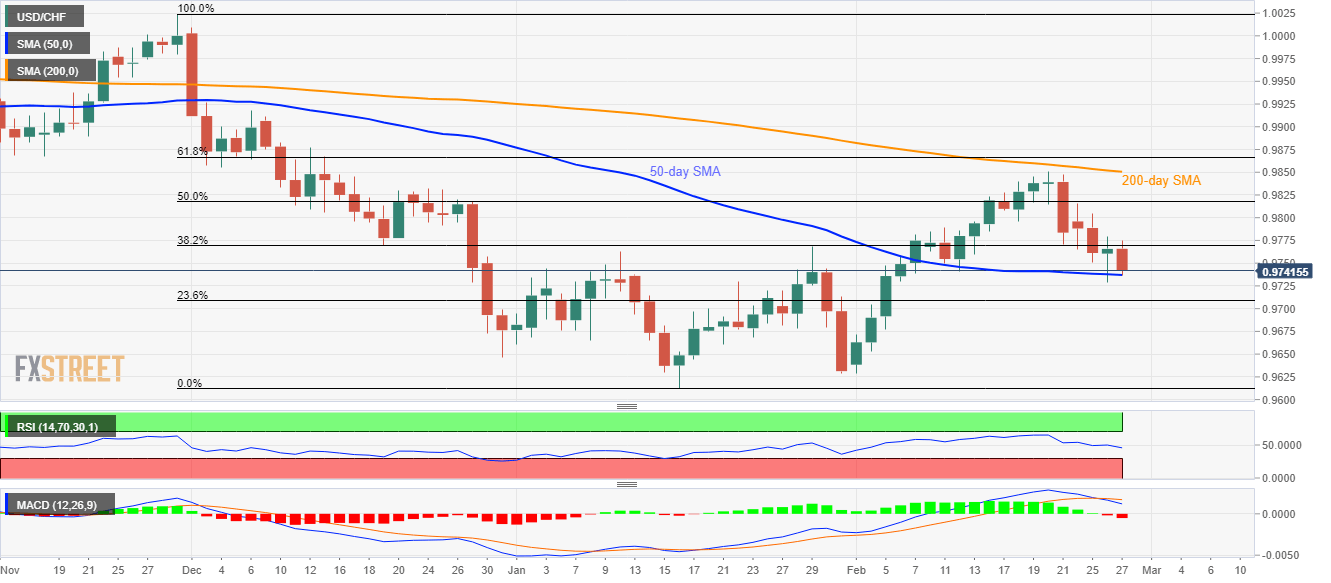
USD/CHF trades near a three-week low. Bearish MACD, failures to carry the latest recovery keep sellers hopeful, 50-day SMA acts as near-term key support. 200-day SMA, 61.8% Fibonacci retracement act as near-term key resistances. USD/CHF remains on the back foot around 0.9740, down 0.25%, during the initial trading session on Thursday. That said, the quote fails to carry the previous day’s recovery gains. Even so, a 50-day SMA level of 0.9737 acts as the near-term key support stopping the sellers despite bearish MACD. Should prices provide a daily closing below 0.9737, 23.6% Fibonacci retracement of the pair’s declines from November 2019 to January 2020, at 0.9709, can flash on the chart. Assuming the USD/CHF pair’s extended weakness below 0.9709, 0.9700
Topics:
Anil Panchal considers the following as important: 1.) FXStreet on SNB&CHF, 1) SNB and CHF, Featured, newsletter, USD/CHF
This could be interesting, too:
Nachrichten Ticker - www.finanzen.ch writes Die Performance der Kryptowährungen in KW 9: Das hat sich bei Bitcoin, Ether & Co. getan
Nachrichten Ticker - www.finanzen.ch writes Wer verbirgt sich hinter der Ethereum-Technologie?
Martin Hartmann writes Eine Analyse nach den Lehren von Milton Friedman
Marc Chandler writes March 2025 Monthly
- USD/CHF trades near a three-week low.
- Bearish MACD, failures to carry the latest recovery keep sellers hopeful, 50-day SMA acts as near-term key support.
- 200-day SMA, 61.8% Fibonacci retracement act as near-term key resistances.
| USD/CHF remains on the back foot around 0.9740, down 0.25%, during the initial trading session on Thursday. That said, the quote fails to carry the previous day’s recovery gains.
Even so, a 50-day SMA level of 0.9737 acts as the near-term key support stopping the sellers despite bearish MACD. Should prices provide a daily closing below 0.9737, 23.6% Fibonacci retracement of the pair’s declines from November 2019 to January 2020, at 0.9709, can flash on the chart. Assuming the USD/CHF pair’s extended weakness below 0.9709, 0.9700 round-figure and the yearly low surrounding 0.9650 will be in focus of the bears. On the contrary, 50% Fibonacci retracement level around 0.9820, 200-day SMA figures of 0.9851 and 61.8% of Fibonacci retracement, at 0.9865, cap the pair’s short-term recovery. |
USD/CHF daily chart(see more posts on USD/CHF, ) |
Trend: Bearish
Tags: Featured,newsletter,USD/CHF

