USD/CHF confronts 23.6% Fibonacci retracement following the bounce off 21-day SMA. Early month lows add to the support while 38.2% Fibonacci retracement, 50-day SMA will challenge recovery moves. USD/CHF takes the bids to 0.9707 during the pre-Europe session on Friday. In doing so, the pair repeats the tendency of staying beyond 21-day SMA while also confronting 23.6% Fibonacci retracement of its declines from November 29, 2019, to January 16, 2020. The sustained trading above short-term SMA is likely to extend the pair’s pullback moves toward a 38.2% Fibonacci retracement level of 0.9770, following the clear break of 0.9820 mark comprising 23.6% of Fibonacci retracement. However, a 50-day SMA level near 0.9781 and late-December 2019 top surrounding 0.9830 will
Topics:
Anil Panchal considers the following as important: 1.) FXStreet on SNB&CHF, 1) SNB and CHF, Featured, newsletter, USD/CHF
This could be interesting, too:
Nachrichten Ticker - www.finanzen.ch writes Die Performance der Kryptowährungen in KW 9: Das hat sich bei Bitcoin, Ether & Co. getan
Nachrichten Ticker - www.finanzen.ch writes Wer verbirgt sich hinter der Ethereum-Technologie?
Martin Hartmann writes Eine Analyse nach den Lehren von Milton Friedman
Marc Chandler writes March 2025 Monthly
- USD/CHF confronts 23.6% Fibonacci retracement following the bounce off 21-day SMA.
- Early month lows add to the support while 38.2% Fibonacci retracement, 50-day SMA will challenge recovery moves.
| USD/CHF takes the bids to 0.9707 during the pre-Europe session on Friday. In doing so, the pair repeats the tendency of staying beyond 21-day SMA while also confronting 23.6% Fibonacci retracement of its declines from November 29, 2019, to January 16, 2020.
The sustained trading above short-term SMA is likely to extend the pair’s pullback moves toward a 38.2% Fibonacci retracement level of 0.9770, following the clear break of 0.9820 mark comprising 23.6% of Fibonacci retracement. However, a 50-day SMA level near 0.9781 and late-December 2019 top surrounding 0.9830 will challenge the buyers. Alternatively, pair’s daily closing below 21-day SMA level of 0.9700 may recall early-month bottoms close to 0.9665 ahead of testing the monthly low of 0.9613. |
USD/CHF daily chart(see more posts on USD/CHF, )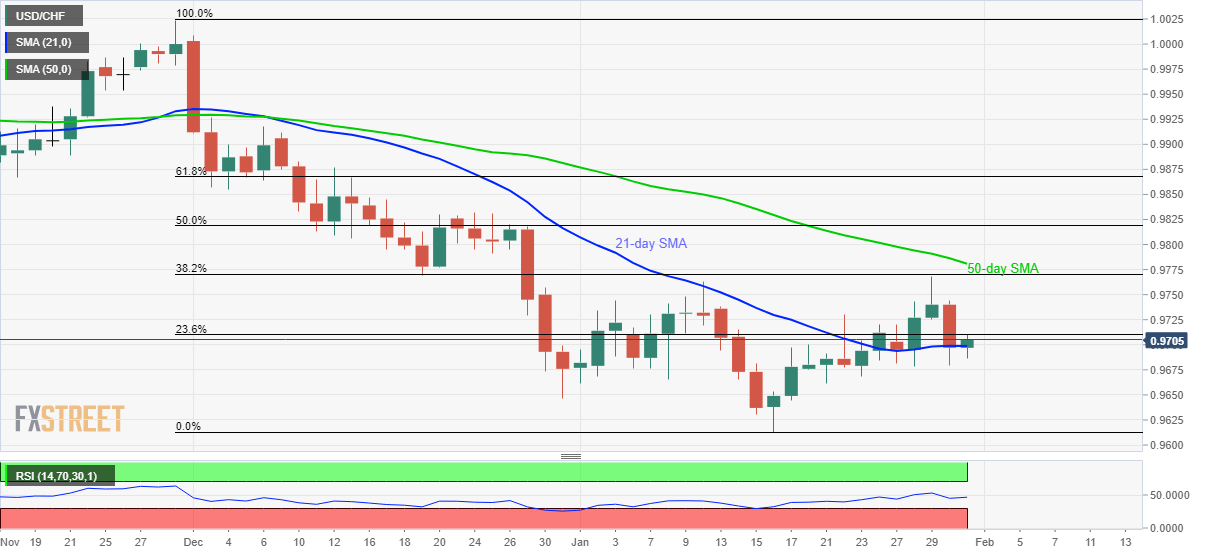 - Click to enlarge |
Trend: Trend: Pullback expected
Tags: Featured,newsletter,USD/CHF