USD/CHF extends recovery gains from the two-day low. Sellers await a downside break of 23.6% Fibonacci retracement. A monthly trend line will keep buyers away. USD/CHF takes rounds to 0.9683 during the pre-European session on Thursday. In doing so, the pair bounces off Tuesday’s low. However, the pair still remains below the monthly resistance line while the MACD flashes the bearish signals for the first time in a week, which in turn portrays the underlying weakness to recall the bears. While 23.6% Fibonacci retracement of the pair’s fall between December 24 and January 16, at 0.9665, acts as the immediate support, major attention will be given to the monthly low surrounding 0.9610. If at all the sellers dominate below 0.9610, September 2018 low near 0.9540 will
Topics:
Anil Panchal considers the following as important: 1.) FXStreet on SNB&CHF, 1) SNB and CHF, Featured, newsletter, USD/CHF
This could be interesting, too:
Nachrichten Ticker - www.finanzen.ch writes Die Performance der Kryptowährungen in KW 9: Das hat sich bei Bitcoin, Ether & Co. getan
Nachrichten Ticker - www.finanzen.ch writes Wer verbirgt sich hinter der Ethereum-Technologie?
Martin Hartmann writes Eine Analyse nach den Lehren von Milton Friedman
Marc Chandler writes March 2025 Monthly
- USD/CHF extends recovery gains from the two-day low.
- Sellers await a downside break of 23.6% Fibonacci retracement.
- A monthly trend line will keep buyers away.
| USD/CHF takes rounds to 0.9683 during the pre-European session on Thursday. In doing so, the pair bounces off Tuesday’s low. However, the pair still remains below the monthly resistance line while the MACD flashes the bearish signals for the first time in a week, which in turn portrays the underlying weakness to recall the bears.
While 23.6% Fibonacci retracement of the pair’s fall between December 24 and January 16, at 0.9665, acts as the immediate support, major attention will be given to the monthly low surrounding 0.9610. If at all the sellers dominate below 0.9610, September 2018 low near 0.9540 will be on their radar. During the pair’s recovery beyond the monthly resistance line, close to 0.9720 now, January 10 high close to 0.9765 will return to the charts. Also, the bulls’ ability to cross 0.9765 will enable them to confront 0.9800 and December 24 high near 0.9835. |
USD/CHF four-hour chart(see more posts on USD/CHF, )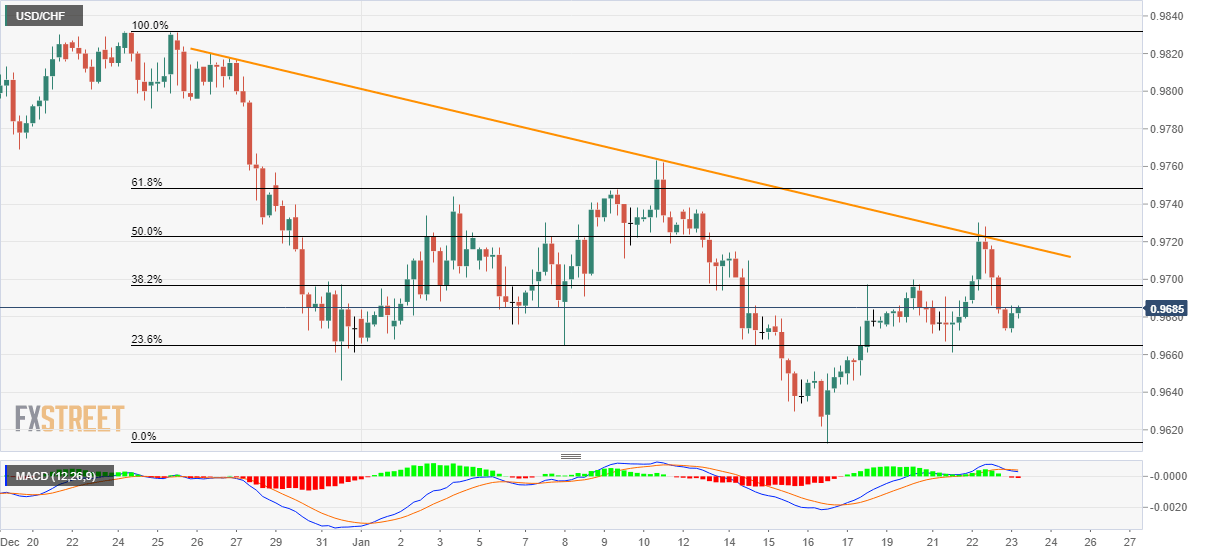 - Click to enlarge |
Trend: Bearish
Tags: Featured,newsletter,USD/CHF