USD/CHF confronts near-term key resistances. The previous week’s low can lure short-term sellers. 50-day EMA, 38.2% Fibonacci retracement confluence add to the resistance. USD/CHF struggles to extend the latest recovery while trading around 0.9700 during Monday’s Asian session. 21-day EMA and 23.6% Fibonacci retracement of the pair’s declines from November 2019 to the current month low seem to restrict the immediate upside. In addition to 0.9711 immediate resistance confluence, a downward sloping trend line since January 10, at 0.9720 now, also challenges short-term buyers. Even if the pair manages to cross 0.9720 barriers, it’s rally isn’t confirmed as 50-day EMA and 38.2% Fibonacci retracement around 0.9770 stands tall to disappoint the bulls. On the flip side,
Topics:
Anil Panchal considers the following as important: 1.) FXStreet on SNB&CHF, 1) SNB and CHF, Featured, newsletter, USD/CHF
This could be interesting, too:
Nachrichten Ticker - www.finanzen.ch writes Die Performance der Kryptowährungen in KW 9: Das hat sich bei Bitcoin, Ether & Co. getan
Nachrichten Ticker - www.finanzen.ch writes Wer verbirgt sich hinter der Ethereum-Technologie?
Martin Hartmann writes Eine Analyse nach den Lehren von Milton Friedman
Marc Chandler writes March 2025 Monthly
- USD/CHF confronts near-term key resistances.
- The previous week’s low can lure short-term sellers.
- 50-day EMA, 38.2% Fibonacci retracement confluence add to the resistance.
| USD/CHF struggles to extend the latest recovery while trading around 0.9700 during Monday’s Asian session. 21-day EMA and 23.6% Fibonacci retracement of the pair’s declines from November 2019 to the current month low seem to restrict the immediate upside.
In addition to 0.9711 immediate resistance confluence, a downward sloping trend line since January 10, at 0.9720 now, also challenges short-term buyers. Even if the pair manages to cross 0.9720 barriers, it’s rally isn’t confirmed as 50-day EMA and 38.2% Fibonacci retracement around 0.9770 stands tall to disappoint the bulls. On the flip side, lows marked on January 01 and 21, around 0.9660, offers the adjacent support to the pair during its further declines. Additionally, the monthly bottom close to 0.9613 and 0.9600 round-figure could lure the bears after 0.9660. |
USD/CHF daily chart(see more posts on USD/CHF, )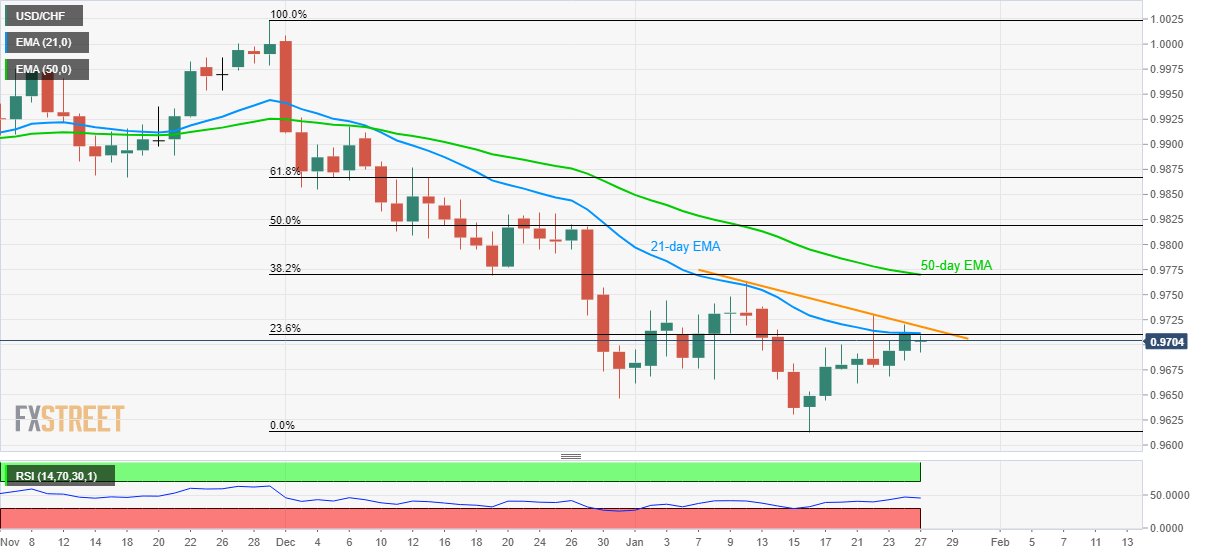 - Click to enlarge |
Trend: Bearish
Tags: Featured,newsletter,USD/CHF