USD/CHF registers five-day winning streak, rises to a one-week high. A downside break of 0.9644 can refresh monthly lows. 38.2% Fibonacci retracement could lure buyers during further upside. USD/CHF takes the bids to 0.9700, following the intra-day high of 0.9702, while heading into the European session on Wednesday. The pair nears the key short-term resistance confluence including 21-day SMA 23.6% Fibonacci retracement of the pair November-January fall and a descending trend line since December 06 around 0.9707/13. Should prices manage to provide a daily closing beyond 0.9717, an extended run-up to 38.2% Fibonacci retracement level of 0.9770 can’t be ruled out. Meanwhile, lows marked on December 31 and January 17 highlights 0.9644 as the immediate support, a
Topics:
Anil Panchal considers the following as important: 1.) FXStreet on SNB&CHF, 1) SNB and CHF, Featured, newsletter, USD/CHF
This could be interesting, too:
Nachrichten Ticker - www.finanzen.ch writes Die Performance der Kryptowährungen in KW 9: Das hat sich bei Bitcoin, Ether & Co. getan
Nachrichten Ticker - www.finanzen.ch writes Wer verbirgt sich hinter der Ethereum-Technologie?
Martin Hartmann writes Eine Analyse nach den Lehren von Milton Friedman
Marc Chandler writes March 2025 Monthly
USD/CHF takes the bids to 0.9700, following the intra-day high of 0.9702, while heading into the European session on Wednesday. The pair nears the key short-term resistance confluence including 21-day SMA 23.6% Fibonacci retracement of the pair November-January fall and a descending trend line since December 06 around 0.9707/13. Should prices manage to provide a daily closing beyond 0.9717, an extended run-up to 38.2% Fibonacci retracement level of 0.9770 can’t be ruled out. Meanwhile, lows marked on December 31 and January 17 highlights 0.9644 as the immediate support, a break of which could push the bears towards refreshing the 16-month low towards 0.9600 round-figure and then to September 2018 bottom surrounding 0.9540. |
USD/CHF daily chart(see more posts on USD/CHF, )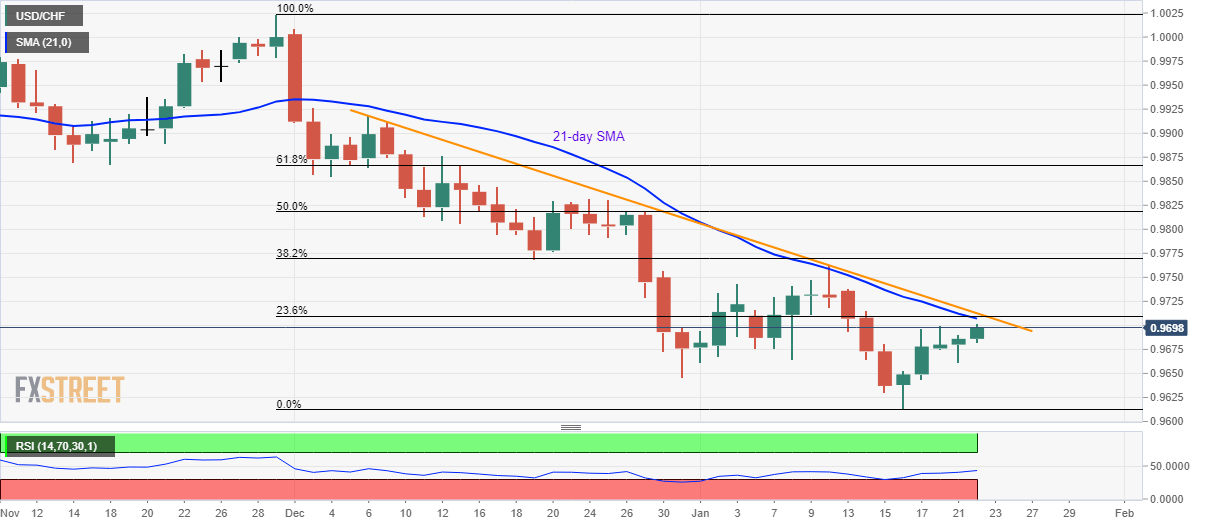 - Click to enlarge |
Trend: Pullback expected
Tags: Featured,newsletter,USD/CHF