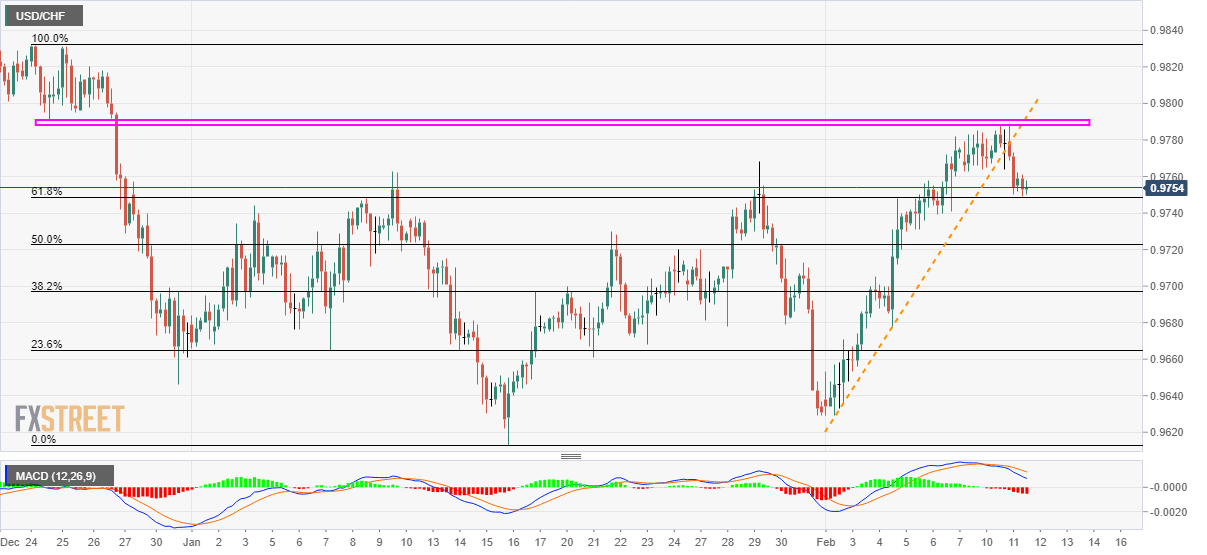
USD/CHF stalls the previous day’s declines after breaking the weekly support line (now resistance). Late-December lows limit immediate upside, 50% Fibonacci can check the declines. Bearish MACD favors further weakness in the quote. USD/CHF clings to 0.9755 during the pre-European session on Wednesday. The pair snapped six-day winning streak on the break of an ascending trendline since February 03. However, 61.8% Fibonacci retracement of December 24-January 16 fall restricts the pair’s immediate declines. Also increasing the odds for the pair’s further downside below the key 0.9750 support are bearish MACD signals, which in turn could drag the quote to January 22 high near 0.9730. During the pair’s further weakness past-0.9730, 50% of Fibonacci retracement
Topics:
Anil Panchal considers the following as important: 1.) FXStreet on SNB&CHF, 1) SNB and CHF, Featured, newsletter, USD/CHF
This could be interesting, too:
Nachrichten Ticker - www.finanzen.ch writes Die Performance der Kryptowährungen in KW 9: Das hat sich bei Bitcoin, Ether & Co. getan
Nachrichten Ticker - www.finanzen.ch writes Wer verbirgt sich hinter der Ethereum-Technologie?
Martin Hartmann writes Eine Analyse nach den Lehren von Milton Friedman
Marc Chandler writes March 2025 Monthly
- USD/CHF stalls the previous day’s declines after breaking the weekly support line (now resistance).
- Late-December lows limit immediate upside, 50% Fibonacci can check the declines.
- Bearish MACD favors further weakness in the quote.
| USD/CHF clings to 0.9755 during the pre-European session on Wednesday. The pair snapped six-day winning streak on the break of an ascending trendline since February 03. However, 61.8% Fibonacci retracement of December 24-January 16 fall restricts the pair’s immediate declines.
Also increasing the odds for the pair’s further downside below the key 0.9750 support are bearish MACD signals, which in turn could drag the quote to January 22 high near 0.9730. During the pair’s further weakness past-0.9730, 50% of Fibonacci retracement around 0.9720 and 0.9700 mark will be the keys to watch. On the flip side, a horizontal area since December 24 near 0.9790 could keep challenging the buyers, a break of which will accelerate the run-up towards 0.9820 and 0.9835 numbers to the north. |
USD/CHF four-hour chart(see more posts on USD/CHF, ) |
Trend: Bearish
Tags: Featured,newsletter,USD/CHF

