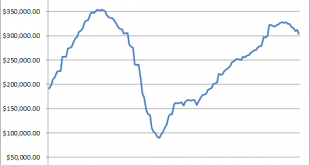
Tax Receipts vs. the Stock Market Following the US Treasury’s update of April tax receipts, our friend Mac mailed us a few charts showing the trend in corporate tax payments. Not surprisingly, corporate tax payments and refunds mirror the many signs of a slowing economy that have recently emerged. An overview in chart form follows below. First up, corporate tax receipts in absolute figures. Corporate Tax Receipts Corporate tax receipts in absolute dollars and cents – this is quite...
Read More »With Fiat Money, Everything Is Relative
What Determines a Currency’s Value? At the end of March the price of the euro in terms of US dollars closed at 1.1378. This was an increase of 4.7 percent from February when it increased by 0.3 percent. The yearly growth rate of the price of the euro in US dollar terms jumped to 6 percent in March from minus 2.9 percent in February. EUR-USD, 2007 – today,monthly – click to enlarge. According to most experts currency rates of exchange appear to be moving in response to so many...
Read More »Peak Data: When Not Enough Is Already Too Much
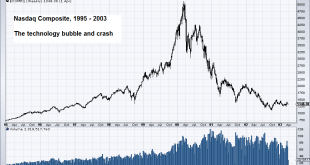
The Wild 1990s Not so long ago, during 1990’s, the connecting world of the connected world we now know was literally and comprehensively in the development stage during those wild crazy go go years before the crash in technology stocks in 2000. Nasdaq Composite, 1995 – 2003, The technology bubble and crash The infamous tech bubble of the 1990s – to this day the greatest stock market bubble ever seen in the US (in terms of multiple expansion, intensity, public participation, speed and...
Read More »US Economy – Gross Output Continues to Slump
The Cracks in the Economy’s Foundation Become Bigger Decay… Photo credit: bargewanderlust Last week the Bureau of Economic Analysis has updated its gross output data for US industries until the end of Q4 2015. Unfortunately these data are only available with a considerable lag, but they used to be published only once every few years in the past, so the current situation represents a significant improvement. As Ned Piplovic summarizes in his update on the situation on Dr. Mark...
Read More »The “Canary in the Coal Mine” for Chinese Stocks
The Largest Online Marketplace in the World This company is twice the size of Enron at its peak ($100 billion). Pharmaceutical giant Valeant, which blew up in the last year, was only $90 billion at its peak. Before I get to what the stock is, let me tell you where it is: China. CEO Jack Ma, wagging a finger (bad sign) Photo credit: Kiyoshi Ota / Bloomberg I recently heard an excellent presentation by Anne Stevenson-Yang at Grant’s Spring Investment conference. Stevenson-Yang is the...
Read More »Rational Insanity
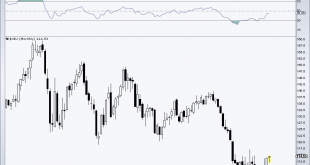
Intel Employees Get RIF’d Dark storm clouds gather along the economic horizon. They multiply ominously with each passing day. The recovery, weak as it has been, has run for nearly seven years. Now it appears to be sputtering and stalling out. Intel (INTC), monthly. The stock has performed fairly well since 2009 (most stocks have), but has yet to regain its bubble peak made 16 years ago. Its recent earnings report (“beating expectations”, natch) reminded us strongly of the accounting...
Read More »100 Years of Mismanagement
Lost From the Get-Go There must be some dark corner of Hell warming up for modern, mainstream economists. They helped bring on the worst bubble ever… with their theories of efficient markets and modern portfolio management. They failed to see it for what it was. Then, when trouble came, they made it worse. But instead of atoning in a dank cell, these same economists strut onto the stage to congratulate themselves. Keynes, Photo via MIT Press The scalawag himself. Keynes provided...
Read More »Fighting Recessions with Hot Air
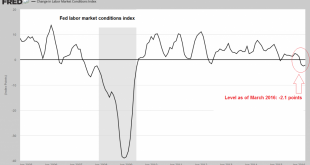
“Prepping” for Recession GUALFIN, Argentina – Stocks are going up all over the world. Meanwhile, it appears to us that the U.S. economy is going down. Go figure. For instance, a labor-market index created by Fed economists… and closely watched by Fed chief Janet Yellen… has fallen for three straight months. It’s the first time that’s happened since 2009. In spite of relatively strong payrolls data, the Fed’s labor market conditions index doesn’t look so hot – click to enlarge. And...
Read More »A Morally Sound Tax Reform Proposal
The Oppressed U.S. Taxpayer This year, Americans’ day of tribute to their federal overlords falls on April 18. As calculated by the Tax Foundation, the average American will work from January 1 to April 24 (Tax Freedom Day) to pay his share of taxes to all levels of government with some $3.3 trillion to be forked over to the federal government and $1.6 trillion to state and local jurisdictions. [1] Image via forbes.com While any talk of tax cuts are verboten on the Democratic...
Read More »US Economy – Ongoing Distortions
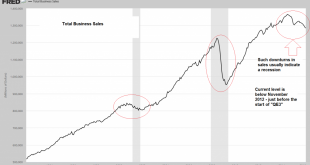
Business under Pressure A recent post by Mish points to the fact that many of the business-related data that have been released in recent months continue to point to growing weakness in many parts of the business sector. We show a few charts illustrating the situation below: A long term chart of total business sales. The recent decline seems congruent with a recession, but many other indicators are not yet confirming a recession – click to enlarge. Wholesale inventories to sales...
Read More » Swiss Economicblogs.org

