Gold is doing what it is supposed to do! Equity markets are tumbling, “NASDAQ 100 Rout Erases .5 Trillion in Market Value in 3 Days” reads one Bloomberg headline. The big names such as Apple lost over US5 billion, Microsoft almost US0 billion, Amazon and Tesla each lost US5 billion market value over the three trading days from May 4 to May 9. Bonds are also declining in value as yields are rising. The market selloff has been the most extreme in the tech sector, but most major indices are lower year-to-date. The chart below shows the gold price along with five different equity indices. In order to compare performance since the beginning of the year, we set January 4, 2022, to 100. Equity markets have tumbled sharply since the beginning of the year
Topics:
Stephen Flood considers the following as important: 6a.) GoldCore, 6a) Gold & Monetary Metals, Bitcoin, Commentary, Crypto, cryptocurrency, currency, Dow Jones, Economics, economy, Euro, Featured, Finance, forex, Geopolitics, Gold, gold and silver, gold market, gold price, gold price analysis, gold price prediction, gold price today, inflation, Markets, News, newsletter, Precious Metals, S&P 500, S&P 500, silver, stock market, Stock markets, stocks
This could be interesting, too:
finews.ch writes BNP Paribas Schweiz hat den Kompass neu ausgerichtet
finews.ch writes Lombard Odier holt erfahrene Client-Manager in Asien an Bord
finews.ch writes Primärmarkt im März: Krisen bremsen Emissionsgeschäft nicht
finews.ch writes Amina Bank: Risikochef Markus Blattmann tritt ab
| Gold is doing what it is supposed to do!
Equity markets are tumbling, “NASDAQ 100 Rout Erases $1.5 Trillion in Market Value in 3 Days” reads one Bloomberg headline. The big names such as Apple lost over US$225 billion, Microsoft almost US$200 billion, Amazon and Tesla each lost US$175 billion market value over the three trading days from May 4 to May 9. |
 |
| Bonds are also declining in value as yields are rising. The market selloff has been the most extreme in the tech sector, but most major indices are lower year-to-date.
The chart below shows the gold price along with five different equity indices. In order to compare performance since the beginning of the year, we set January 4, 2022, to 100. Equity markets have tumbled sharply since the beginning of the year while the gold price is positive. To recap, you own gold because it does not move to the beat of someone else’s drum. It has zero counterparty risk, so no bank or prime broker holds your position for you in some mingled pot of securities belonging to over-leveraged hedge funds. No hedge fund has ever blown itself up by holding physical gold, but if they hold levered gold then it’s no longer the hard, tangible golden asset that you need to have in order to prevent said blow-up!! |
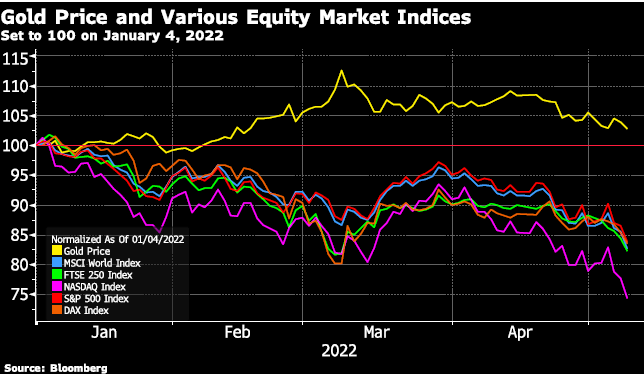 Gold Price and Various Equity Market Indices Chart |
The Market Interaction in Gold and Stock MarketsTaking a longer view of the same equity indices and the gold price, the chart below is set at 100 at the beginning of 2000. The sharp rise in the NASDAQ (tech stocks) since the start of 2020 can be seen in the chart – and now the subsequent fall. Those same tech stocks that are plummeting now, are the ones that drove the NASDAQ higher in 2020 and 2021. This 2000 onwards chart shows the secret bull market in physical gold has been unmatched by any of the five equity indices. As we have written many times before … gold outperforms because it reflects the heat of inflation caused by central banks. Equities cannot keep pace because companies compete with one another in a way that consumes money thereby preventing the rapid compounding of results by a single company. Equally as important to note – equity indices rise and fall with the waves of liquidity fed into our banking system, yet gold is outside the system and immune to those waves. |
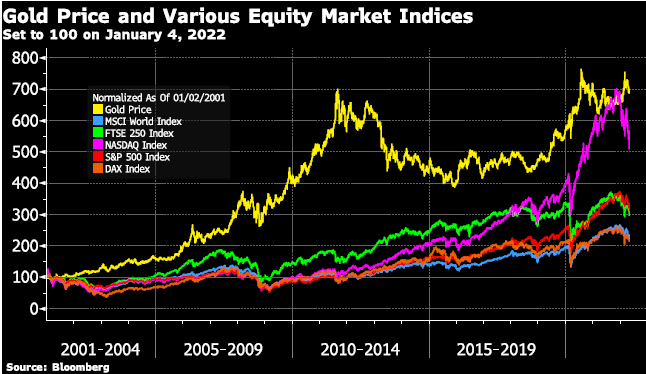 Gold Price and Various Equity Market Indices Chart |
| Bond prices are also declining. Higher inflation expectations are pushing government bond yields higher – US 10-year Treasury yields, and UK government Gilt yields have risen to over 3%.
Bond yields are inverse to bond prices, so a rise in bond yields means that the bond prices are going down. Speaking of bond yields, this week’s GoldCore TV guest, Patrick Karim, has some great charts which he shares with us in our latest interview. He believes both gold and silver are set for a sustained rally. He reaches this conclusion when looking at both US 10-year Treasury yields and US 30-year Treasury yields… |
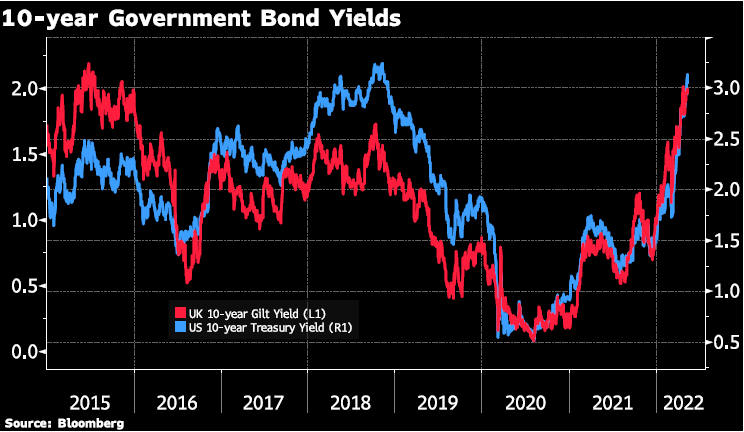 10-Year Government Bond Yields Chart |
| Patrick also talks to us about the importance of looking at the gold price in different currencies. The gold price, like other commodities and currency prices, is generally quoted in U.S. dollars.
The U.S. dollar has risen sharply in 2022 as the Federal Reserve (the U.S. central bank) is tightening policy and raising interest rates faster than other central banks. This means that gold in other currencies (another way to think about this is the cross rate of gold in other currencies) has risen more than the price of gold quoted in U.S. dollars this year to date. Check out our interview with Patrick Karim to see some shocking charts showing the gold price in other currencies. |
 Gold Price in Various Currencies Chart |
Is Bitcoin the New Gold?And where is Bitcoin on all this – selling off as much or more than equity markets! Maybe the endless years of claims about bitcoin being the new digital replacement for gold are put to rest in 2022. So far it does not seem that bitcoin outperforms gold during times of trouble. The bitcoin trades more like Nasdaq stocks trade rather than like physical gold. Stories abound now about investors and companies being over-leveraged in bitcoin. Billionaire CEO of Microstrategy, Michael Saylor, lead the company into taking on US dollar debt in order to invest in bitcoin, a move which in 2022 looks increasingly reckless. The key point here is not that bitcoin is down in 2022 while gold is down by less. No, the key point is that during this crisis bitcoin is down whilst gold is up. Bitcoin has been touted as gold 2.0 on many occasions, the implication that it can do even more than gold. However, right now it is not making itself many friends. |
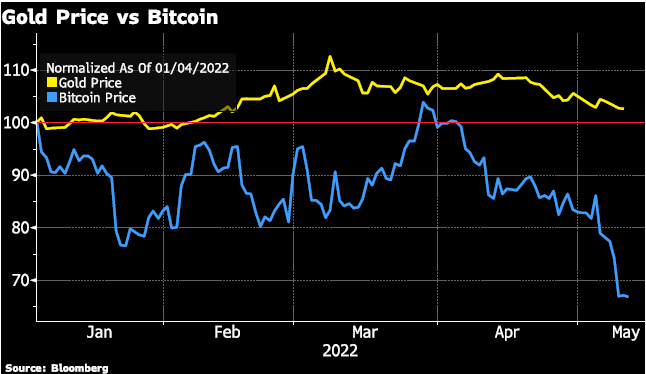 Gold Price V/S Bitcoin Chart |
| The final chart of our tour this week is gold divided by the SP500 equity index. You can see that a ratio value of 1 is not unusual. Perhaps in 2022, this will occur again when gold and SP500 are both trading at US$2,900 US!
Watch this week’s interview to find out why Patrick Karim believes gold and silver are set to soar, and why we are all “Going to have to go to gold, there is no escape.” |
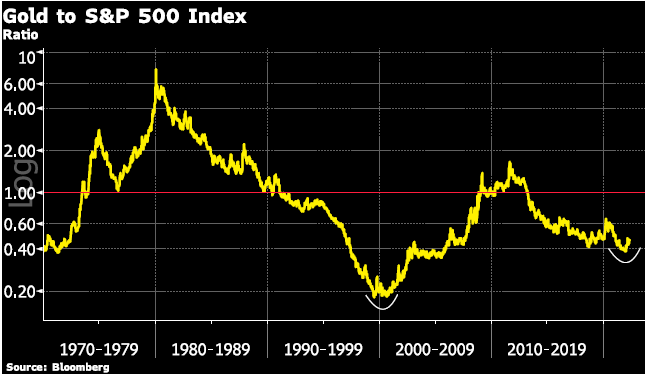 Gold to S&P 500 Index Chart |
You Might Also Like
 Expect the Unexpected from the Fed
2022-04-28
It has been a rough week in most markets with both equities and bonds declining sharply. Tech stocks have been pummeled with many ‘big names’ plunging more than 50% (from their 52-week high). Some of the bigger names include Zoom Video -75%, PayPal -73%, Netflix -72%, Meta Platforms (Facebook), -53%.
 Is The Ruble Backed By Gold Now?
2022-04-16
Over the past couple of weeks, we reviewed the U.S. government confiscation of gold by Executive Order in 1933. (see “Gold Confiscation: Will History Repeat Itself?” and “The Facts of Gold Confiscation: The Saga Continues”).
2022-03-24
Dave Russell of GoldCore TV welcomes back Gareth Soloway of InTheMoneyStocks.com where we ask if the bull market for stocks is back and if $2,500 on gold is still on the cards for 2022?
 Gold Gives You Personal Sovereignty
2022-03-09
Dave Lukas of Misfit Entrepreneur invites Stephen Flood, CEO of GoldCore, to the show. Dave and Stephen talk about what people should know before investing in gold and silver, the present state of inflation, central banking, and the monetary system.
Further, he explains why gold is still your safe-haven asset and how it provides you with personal sovereignty. They also talk about cryptocurrencies and their future.
Stephen also discusses some of the lessons he’s learned along the route to being a successful entrepreneur.
Click Below to Listen to the Podcast
Download Your Essential Checklist
The Truth About The National DebtWatch David M Walker Only on GoldCore TV
GOLD PRICES (USD, GBP & EUR – AM/ PM LBMA Fix)
07-03-2022 1999.25 1980.95 1520.63 1505.52
 The ‘Fed Put’ – Gone Until There’s Blood in the Streets
2022-01-30
The ‘Fed put’ – gone until there’s blood in the streets
Well, it’s happening. Bitcoin (and other cryptocurrencies are sharply down, along with equity markets in many advanced economies.
And the Federal Reserve (the U.S. Central Bank) statement and press conference on Wednesday didn’t indicate any backing down from raising interest rates, maybe as soon as the March meeting.
The Fed’s stance pivot from ‘the economy needs additional stimulus’ to ‘it is time to start tightening policy’ came at the end of 2021 when Fed officials changed their view that 40-year high readings on consumer price inflation was due to transitory factors and will subside on its own.
Their new stance that high inflation is permanent and is what ensures tighter policy. The Fed has already started
 Gold Price News: Gold Down 1% in Wake of More Hawkish Federal Reserve Meeting Minutes
2022-01-09
Gold price fell to $1,808 an ounce in the wake of the release of the minutes of the December Federal Reserve meeting, having hit an intra-day high of $1,829. Silver price fell to $22.72 an ounce from an intra-day high of $23.26.
 The Black Friday Stock Market Crash – Gareth Soloway
2021-11-30
Black Friday 2021 saw the largest stock market sell-off since 1931.
Is this the start of a bigger crash, has the trend changed or is this just a one-time blip?
We ask Gareth Soloway of InTheMoneyStocks.com what his charts are suggesting and why he is so bullish on gold
Watch the Video to Learn More
Make sure you don’t miss a single episode… Subscribe to our YouTube channel
Click Here to Download Your Copy Now
Inflation is EverywhereWatch Kevin Muir only on GoldCore TV
GOLD PRICES (USD, GBP & EUR – AM/ PM LBMA Fix)
26-11-2021 1809.80 1800.80 1358.44 1350.78 1604.75 1594.9725-11-2021 1790.65 1788.15 1343.88 1343.44 1595.83 1594.3124-11-2021 1790.80 1782.05 1339.70 1336.00 1596.50 1590.4823-11-2021 1797.30 1789.15 1344.02 1337.93 1595.82
 Why Governments Hate Gold
2021-11-27
Do governments hate gold? The answer: Yes — Governments hate gold because they cannot print it, and it is difficult for them to control.
Tags: Bitcoin,Commentary,crypto,cryptocurrency,Currency,Dow Jones,Economics,economy,Euro,Featured,Finance,Forex,Geopolitics,Gold,gold and silver,gold market,gold price,gold price analysis,gold price prediction,gold price today,inflation,Markets,News,newsletter,Precious Metals,S&P 500,silver,stock market,Stock markets,stocks