As credit-asset bubbles pop, the dominoes start falling. The economy is far more precarious than the surface boom/bubble suggests. A great many households, enterprises and municipalities are in overloaded boats whose gunwales are just a few inches above the water; the slightest wave will swamp and sink them. The cost structure of the economy is completely out of whack with what households and enterprises can afford. There are several dynamics in play: 1. Enterprises have already stripped out all the expenses they can: head count has been cut, quality has been gutted, quantity has been reduced, supply chains have been squeezed, inventory controls trimmed to just-in-time and so on. There are no easy, quick cost
Topics:
Charles Hugh Smith considers the following as important: 5) Global Macro, Featured, newsletter, The United States
This could be interesting, too:
Nachrichten Ticker - www.finanzen.ch writes Die Performance der Kryptowährungen in KW 9: Das hat sich bei Bitcoin, Ether & Co. getan
Nachrichten Ticker - www.finanzen.ch writes Wer verbirgt sich hinter der Ethereum-Technologie?
Martin Hartmann writes Eine Analyse nach den Lehren von Milton Friedman
Marc Chandler writes March 2025 Monthly
| Costs have tripled in 24 years, but have wages tripled? No. In many cases, they haven’t even kept pace with official inflation, much less real-world inflation. How many people earning $40,000 in 1995 are now earning $67,000, the minimum increase needed to match the rise in official inflation? Nobody I know. How many positions paying $40,000 in 1995 are now paying $120,000 for the same job? I think we can safely say none.
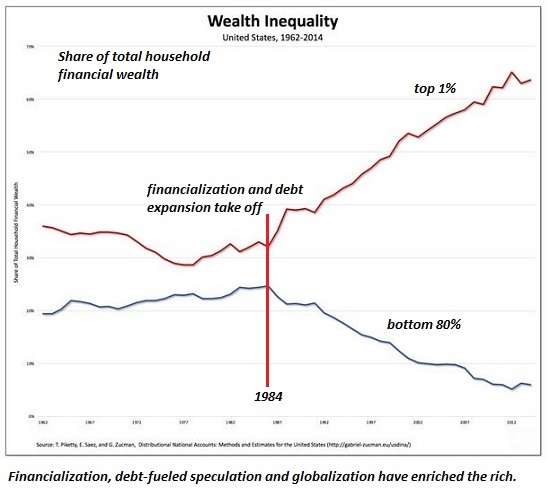
3. The majority of gains in income and wealth have flowed to the top 5%, and most of the gains in the top 5% have flowed to the apex of that income bracket. So when we read that average household wealth has increased or median wages have increased, the reality is these statistics mask the actual distribution of income and wealth gains, which are skewed heavily to the top 5% income/wealth brackets. This chart is a few years old but the trend hasn’t changed. |
Spending by the top 5% pulls away from the 95% |
| Long-term distribution of gains continues to favor the top 1%.
Enterprises are precarious because their costs are high and there’s nothing left to cut. A relatively modest decline in revenues will cut profits / owners’ incomes to less than zero. Households in high-cost regions are barely above water. Any reduction in household income will push these households into insolvency. As credit-asset bubbles pop, the dominoes start falling. As real estate rolls over, lending and construction activity decline, triggering layoffs. As household income takes a hit, the days of spending $15 for lunch every day plus a $5 coffee and $4 bagel go away. The only way for enterprises absorbing revenue declines to survive is to lay off employees, which reduces the pool of consumers with disposable income. |
Wealth Inequality 1962-2014 |
Tags: Featured,newsletter


