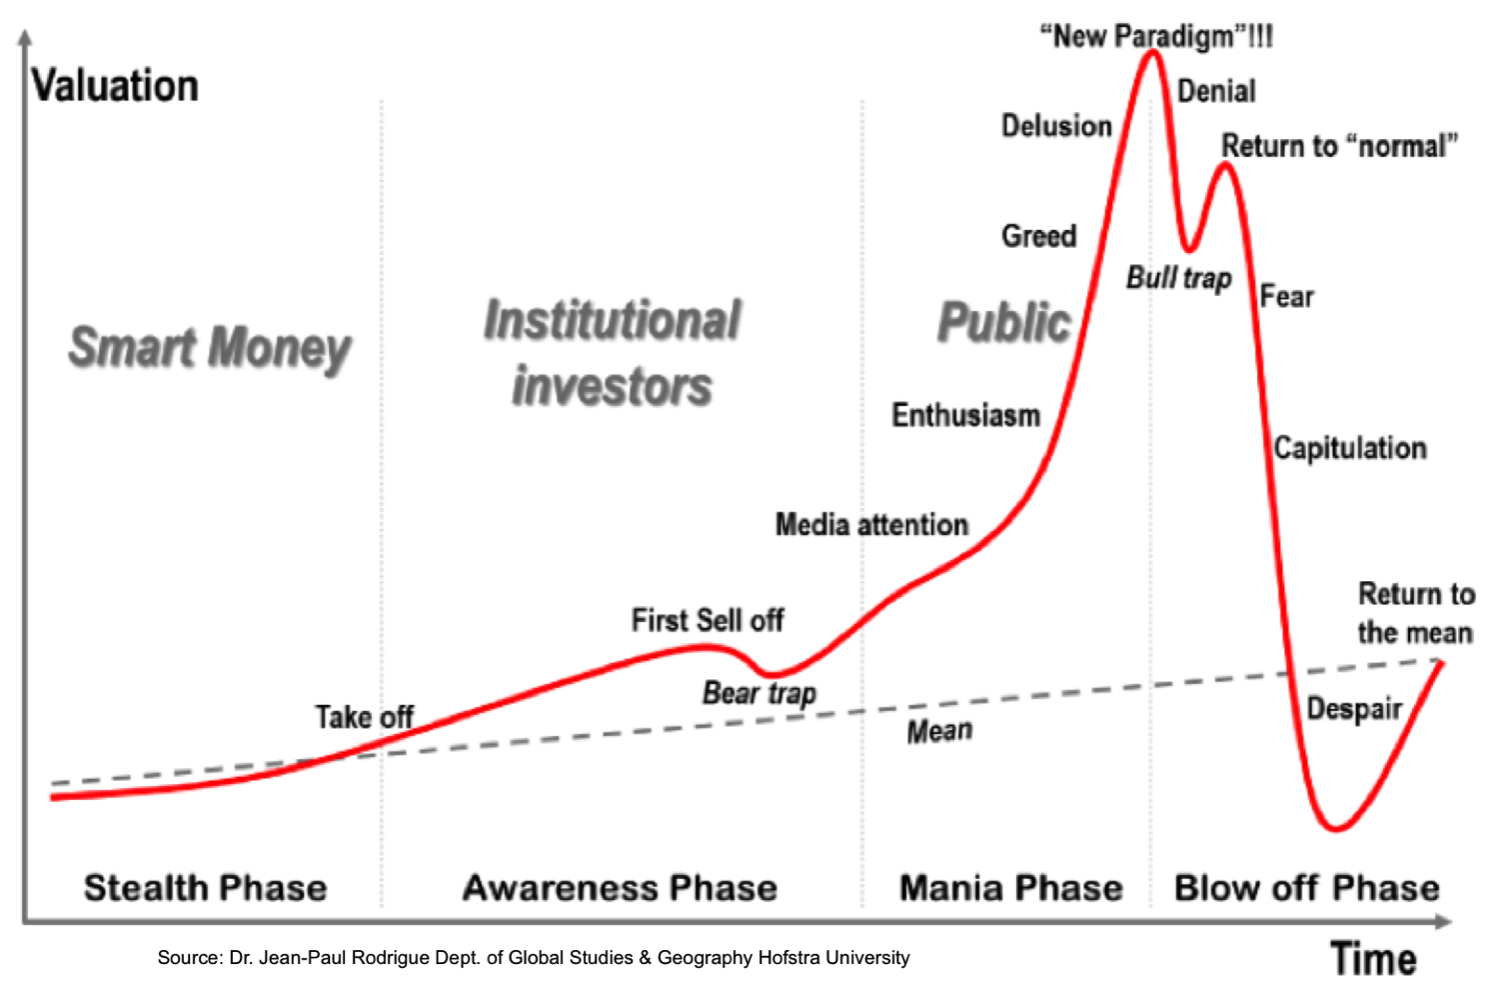
“This Is Where They Completely Lost Their Minds” – Hussman– Hussman warns ‘the S&P 500 to lose approximately two-thirds of its value over the completion of this cycle’– ‘the market has lost value, even since 2009, when overvalued, overbought, overbullish conditions were joined by divergent internals’– Believes the market is going to learn lessons about the crash ‘the hard way’ - Click to enlarge In an almost prophetic blog post from John Hussman last week, we are warned about the bubble waiting to collapse in the US equity market and the hard lesson investors are about to learn. Drawing on both his own experience and the work of the much revered Didier Sornette, Hussman looks at the current state of the US
Topics:
Jan Skoyles considers the following as important: Daily Market Update, Featured, GoldCore, newsletter
This could be interesting, too:
Nachrichten Ticker - www.finanzen.ch writes Die Performance der Kryptowährungen in KW 9: Das hat sich bei Bitcoin, Ether & Co. getan
Nachrichten Ticker - www.finanzen.ch writes Wer verbirgt sich hinter der Ethereum-Technologie?
Martin Hartmann writes Eine Analyse nach den Lehren von Milton Friedman
Marc Chandler writes March 2025 Monthly
| “This Is Where They Completely Lost Their Minds” – Hussman – Hussman warns ‘the S&P 500 to lose approximately two-thirds of its value over the completion of this cycle’ – ‘the market has lost value, even since 2009, when overvalued, overbought, overbullish conditions were joined by divergent internals’ – Believes the market is going to learn lessons about the crash ‘the hard way’ |
|
| In an almost prophetic blog post from John Hussman last week, we are warned about the bubble waiting to collapse in the US equity market and the hard lesson investors are about to learn.
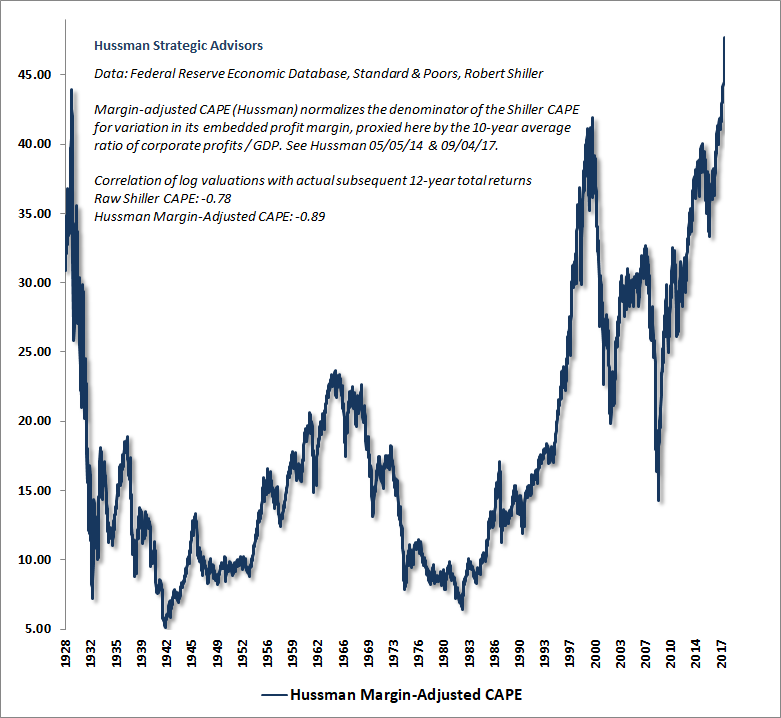
Drawing on both his own experience and the work of the much revered Didier Sornette, Hussman looks at the current state of the US equity market, where it sits in its cycle and how it compares to history. The prognosis is not good. Hussman warns that ” the market has lost value, even since 2009, when overvalued, overbought, overbullish conditions were joined by divergent internals…I expect the S&P 500 to lose approximately two-thirds of its value over the completion of this cycle.” Of course, the lesson may have finally begun. On Monday February 5th the Dow Jones dropped over 1,000 points, the largest single day drop ever, on a points-basis. Meanwhile, also on the 5th, the S&P500 went negative for 2018 closing down more than 7 percent from a record set in January. Similar action was repeated on the 8th February, with many traders declaring they’d never seen anything like it. Gold performed well following the rout and we believe gold prices may rise further as the drama leads period of risk aversion and a new found appreciation by investors looking for gold’s hedging and safe haven attributes. You can hear more about our bubble crash predictions in our Goldnomics podcast. Here we take a look at one of the important financial questions of our day – is this the greatest stock market bubble in history? Excerpts taken from ‘Measuring the Bubble’ on 1st February 2018 Last week, the U.S. equity market climbed to the steepest valuation level in history, based on the valuation measures most highly correlated with actual subsequent S&P 500 10-12 year total returns, across a century of market cycles |
Hussman Margin-Adjusted CAPE, 1928 - 2018 |
As Didier Sornette correctly observed in Why Markets Crash,
My sense is that investors are going to learn this again the hard way. On the accelerating slope of the current advanceSpeaking of Didier Sornette, I’ve periodically discussed his concept of “log periodic power-law” price behavior, which has accompanied speculative episodes in numerous markets and often precedes inflection points or collapses. This structure is based on a purely mathematical fit to price behavior, and does not reflect any valuation considerations. It’s not part of our own investment discipline, but we occasionally fit the log-periodic structure to price behavior when market movements are particularly extreme. In recent years, those structures have generally identified inflection points of flat or correcting prices, but certainly not crashes in the S&P 500. Given the increasingly steep slope of the current market advance, along with the most extreme valuations in history and the most lopsided bullish sentiment in more than three decades, it’s quite possible that this instance will be different. In any event, the underlying “arbitrage” considerations described by Sornette are worth reviewing here. In 2000, as the tech bubble was peaking, Nobel laureate Franco Modigliani observed that the late stages of a bubble can be “rational” in a certain sense, provided that investors are inclined to self-reinforcing behavior. Imagine a market that you fully believe to be overvalued and at risk of a market crash. Indeed, let’s say that there is a defined probability of a crash, which increases rapidly as the pitch of the market advance becomes more extreme. Should you sell? Well, it depends. Given that an immediate crash is not certain, a speculator must, in each period, weigh the potential gain from holding a bit longer against the potential loss from overstaying. Sornette uses a similar argument to describe a speculative bubble advancing toward its peak (italics mine):
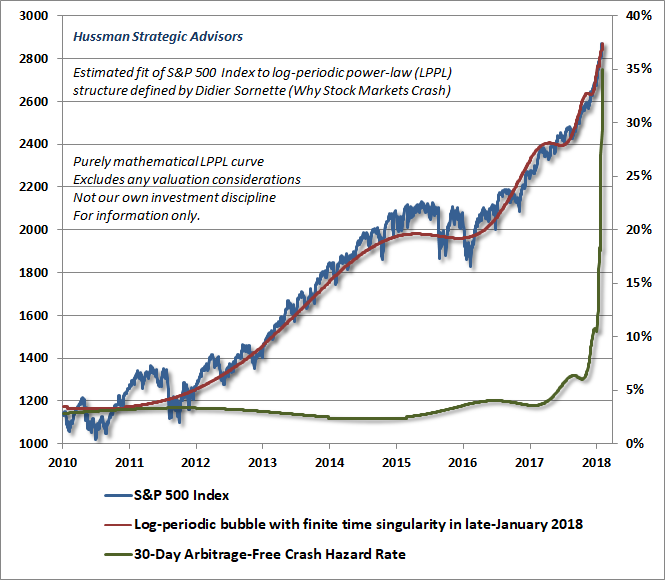
The chart below shows our current best-fit parameterization of Sornette’s log-periodic structure, applied to the S&P 500 Index. Notably, unless we allow for the slope of the current market advance to become quite literally infinite, it’s impossible to closely fit the current price advance without setting the “finite-time singularity” – the point at which instability typically emerges – within a few days of the present date. Notably, the singularity is not the date of a crash. Rather, it’s the point where the pitch of the advance reaches an extreme, which may simply be an inflection point (as has been the case for other structures in recent years) or a pre-crash peak. |
S&P 500 Index, Log-periodic Bubble and Arbitrage-Free Crash Hazard Rate, 2010 - 2018(see more posts on S&P 500, ) |
The collapse is fundamentally due to the unstable position; the instantaneous cause of the crash is secondary.
– Didier Sornette
If you want my opinion (which we don’t trade on and neither should you), my opinion is that this singularity will prove to be more than an inflection point.
Though nearly every morning prompts the phrase “Yup, they’re actually going to do this again,” the steepening pitch of this ascent – coupled with record valuation extremes, record overbought extremes, and the most lopsided bullish sentiment in over three decades – now produces the most extreme “overvalued, overbought, overbullish” moment in history. In prior cycles across history, similar syndromes were either joined or quickly followed by deterioration in market internals. In this cycle, it has been essential to wait for explicit deterioration in market internals before establishing a negative outlook. Notably, the market has lost value, even since 2009, when overvalued, overbought, overbullish conditions were joined by divergent internals.
I expect the S&P 500 to lose approximately two-thirds of its value over the completion of this cycle.
My impression is that future generations will look back on this moment and say “… and this is where they completely lost their minds.”
As I’ve regularly noted in recent months, our immediate outlook is essentially flat neutral for practical purposes, though we’re partial to a layer of tail-risk hedges, such as out-of-the-money index put options, given that a market decline on the order of even 5% would almost certainly be sufficient to send our measures of market internals into a negative condition. It’s best not to rely on the ability to execute sales into a falling market, because the range-expansion we’ve recently seen on the upside may very well have a mirror-image on the downside. As usual, we’ll respond to new evidence as it emerges.
Tags: Daily Market Update,Featured,newsletter


