The US repo market appears to finally be normalizing. The low pace of normalization is concerning and so a more permanent solution may be needed to head off similar problems at year-end. We do not think this issue has any implications for the economic outlook, which we continue to view as solid. RECENT DEVELOPMENTS The repo market provides an efficient, reliable, and predictable channel to raise short-term funding. It is but one part of a larger short-term funding market. As such, there were serious concerns that dislocations in the repo market would lead to contagion that froze other parts of the financial markets. That has proven to be overblown, with repo rates reacting favorably to the Fed’s frequent temporary liquidity adds over the past couple of weeks. Due
Topics:
Win Thin considers the following as important: 5.) Brown Brothers Harriman, 5) Global Macro, Articles, developed markets, emerging markets, Featured, newsletter
This could be interesting, too:
Nachrichten Ticker - www.finanzen.ch writes Die Performance der Kryptowährungen in KW 9: Das hat sich bei Bitcoin, Ether & Co. getan
Nachrichten Ticker - www.finanzen.ch writes Wer verbirgt sich hinter der Ethereum-Technologie?
Martin Hartmann writes Eine Analyse nach den Lehren von Milton Friedman
Marc Chandler writes March 2025 Monthly
| The US repo market appears to finally be normalizing. The low pace of normalization is concerning and so a more permanent solution may be needed to head off similar problems at year-end. We do not think this issue has any implications for the economic outlook, which we continue to view as solid.
RECENT DEVELOPMENTS The repo market provides an efficient, reliable, and predictable channel to raise short-term funding. It is but one part of a larger short-term funding market. As such, there were serious concerns that dislocations in the repo market would lead to contagion that froze other parts of the financial markets. That has proven to be overblown, with repo rates reacting favorably to the Fed’s frequent temporary liquidity adds over the past couple of weeks. Due to a perfect storm of unrelated events, the US repo market basically seized up last month. Companies withdrew cash for quarterly tax payments while settlement of several US Treasury auctions totaling $78 bln added to the imbalance. Both drained the system of liquidity, leading to spikes in overnight lending rates just as markets headed towards quarter-end. Pressures in the repo market led to increased volatility in the Fed Funds rate. Both channels are ways for financial institutions to obtain short-term funding. As such, the two rates are closely linked. That is also why there were fears of contagion. |
Fed Balance Sheet, 2007-2019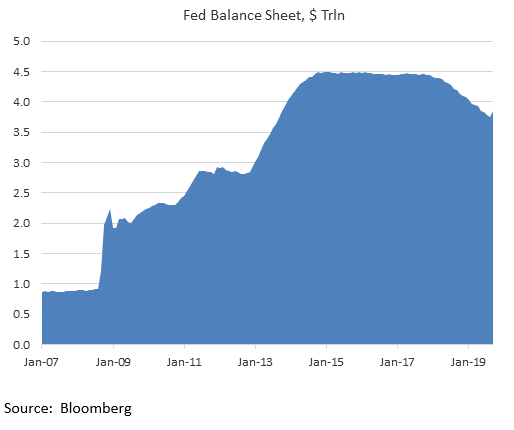 - Click to enlarge |
| It remains to be seen whether a more permanent add will be needed. We suspect the Fed wants the short-term funding markets to normalize first before a decision is made. Several former Fed officials have spoken of the need for a permanent add, with Gagnon and Sack calling for a $250 bln increase in the Fed’s balance sheet over the next two quarters via outright UST purchases.
At the September FOMC meeting, Powell admitted that if the problems are not as temporary as the Fed believes, we could get an organic increase in the Fed’s balance sheet. However, he and other Fed officials have since stressed that such a move shouldn’t be viewed as QE4. We agree. Rather than viewing this as a policy shift, we instead chalk it up to a learning curve as the Fed tries to deal with the unintended consequences of its efforts to move away from its crisis policy settings. There has been more and more chatter that the recent problems have been magnified by a lack of market experience at the NY Fed. Williams (academic) replaced Dudley (Wall Street), but more importantly, there was a major shakeup as it appears that Williams cleaned house. Head of the markets group Simon Potter left unexpectedly back in May, and his post was split in two as part of a restructuring effort. To our knowledge, neither posts have been filled. |
Federal Reserve liabilities/assets, 2007-2019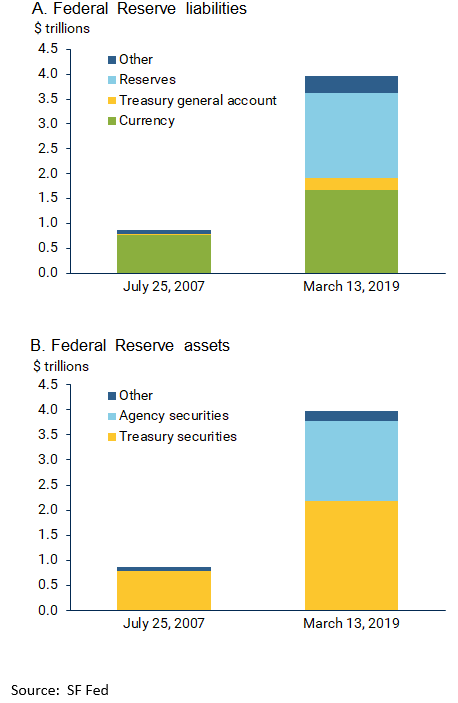 - Click to enlarge |
| A BRIEF ECONOMICS LESSON
The size and composition of the Fed’s balance sheet has shifted significantly. First, the size nearly quintupled from around $900 bln pre-crisis to a peak near $4.5 trln in 2015. Balance sheet run-off has since seen the balance sheet shrink to stand near $3.9 trln currently. Before the financial crisis, the bulk of the Fed’s liabilities was made up of currency in circulation. After the crisis and QE, bank reserves now account for 40% of the Fed’s liabilities, about the same as the share for currency in circulation. It was clear that the Fed’s balance sheet would never shrink back to pre-crisis levels. Currency in circulation has risen as the economy has grown. At the same time, banks are holding greater reserves at the Fed to meet new regulatory requirements that are meant to strengthen the financial system. Yet the Fed felt that some shrinkage was needed once the Fed started moving out of its emergency settings of zero rates and vastly expanded balance sheet. As we have now seen, that shrinkage has dutifully followed the Law of Unintended Consequences. A paper published in June by the San Francisco Fed may help explain why the size of the Fed’s balance sheet has impacted the workings of the short-term funding markets. “Why Is the Fed’s Balance Sheet Still So Big?” doesn’t directly address the current dislocations in the short-term funding markets. However, it provides an easy to understand framework that helps explain what’s happened this past month. The paper writes about bank reserves within a supply-demand framework. Within this framework, Quantitative Easing (QE) saw the Fed flood the market with liquidity from its asset purchases. As a result, the supply of reserves shifted to the right and there was no need for the Fed to ever add liquidity into the system post-crisis to keep the Fed Funds rate low. Until now. As the San Francisco Fed wrote, “Changes in financial regulations that promote holding high-quality liquid assets, like reserves, have made the demand for reserves more uncertain compared with the pre-crisis period. Given that the Fed needs to have precise estimates of this demand to set the appropriate supply of reserves to hit the target for the federal funds rate, any uncertainty could translate into a more volatile federal funds rate.” Bingo. Before the balance sheet began shrinking, the market was in equilibrium where the slope of the demand curve was flat (panel B below). As the SF Fed wrote, “Because banks could borrow overnight from the Fed at an interest rate known as the primary credit rate, the demand for reserves flattened out near that rate. At the other end of the curve, banks did not receive interest on reserves held at the Fed, and the demand for reserves became infinite when the federal funds rate reached zero.” Here, any shifts in the demand curve would only impact that portion with non-zero slope. Any unforeseen shifts in reserve demand would therefore not impact rates. Fast forward to today. Shrinkage in the Fed’s balance sheet apparently pushed the supply of reserves to the left far enough to move its intersection with the demand curve to the portion with a non-zero slope (panel A below). Unforeseen shifts in reserve demand will now impact rates significantly, requiring more Fed action to keep the Fed Funds rate within its target range. This moves the framework back to a pre-crisis one, where the Fed had to regularly intervene to keep Fed Funds at its target. The long-term solution, then, is for the Fed to shift the supply of reserves to the right with a permanent liquidity add. We suspect the Fed is studying the matter now. If dislocations persist into Q4, then we could see a broad outline emerge at the October 30 meeting as to how the Fed will address this. The December 11 FOMC meeting will be too late, given expectations of building year-end pressures that will likely be much worse than the current quarter-end pressures. Stay tuned. |
Bank Demand for Reserves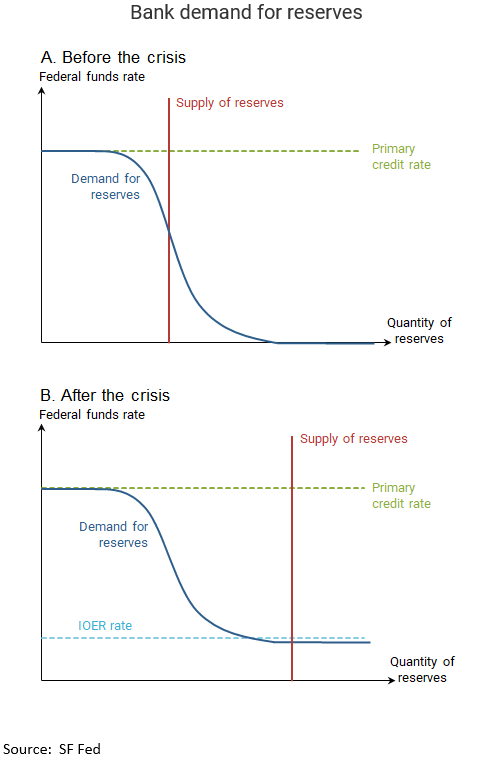 - Click to enlarge |
| A BRIEF HISTORY LESSON
Once upon a time, the Fed did not announce its desired Fed Funds rate. Nor did it announce any changes in policy. Rather, the Fed adjusted this rate with regular Open Market Operations. Wall Street had to hire a veritable army of Fed watchers to study the Fed’s liquidity additions and subtractions to figure out what its policy stance was. Furthermore, the Fed did not always target the Fed Funds rate. It is generally accepted that a central bank can control either the price of money or the quantity of money, but never both. Before 1979, the Fed tried to control the price of money, which meant the Fed Funds rate. That changed when Paul Volcker took over as Fed Chair from G. William Miller in August 1979. In October 1979, Fed Chair Volcker changed the Fed’s approach and began to control the quantity of money, specifically non-borrowed reserves (M1). Because of this new approach to conducting monetary policy, the Fed Funds rate exhibited greater volatility until October 1982, when this experiment ended. It wasn’t until the February 1994 FOMC meeting that the Fed surprised markets and issued an explicit policy statement. Since then, the Fed has added transparency in a series of steps. In 2004, it moved up the release of FOMC minutes to three weeks after the meeting. Previously, minutes were released only after the next meeting, rendering them virtually useless. In 2011, the Fed started holding post-meeting press conferences at the March, June, September, and December meetings, and introduced the infamous Dot Plot. In 2019, the Fed shifted to holding press conferences after every meeting and that is where we stand now. |
ISM PMI, 2012-2019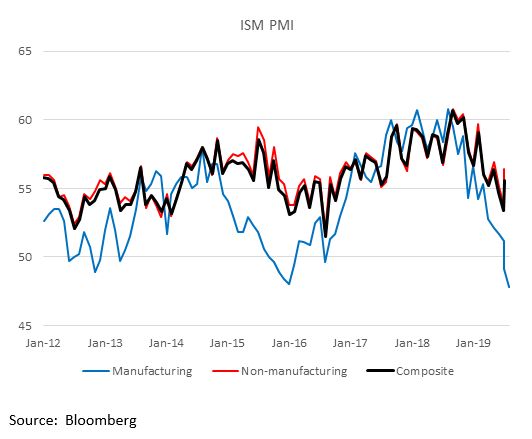 - Click to enlarge |
| ECONOMIC OUTLOOK
September PMI readings were worse than expected. Chicago PMI came in at 47.1 vs. 50 expected, moving back below the 50 boom/bust level. Today, ISM manufacturing PMI came in at 47.8 vs. 50.0 expected and 49.1 in August. Up until August, the US was one of the few countries anywhere to have a manufacturing PMI reading above 50. Clearly, the US-China trade war is having a negative impact on US manufacturing. The GM strike is also a major factor behind the disappointing September readings. Since the strike is still ongoing, it will take some time before we get a truly clean read. ISM non-manufacturing PMI will be reported Thursday and is expected to fall to 55.1 from 56.4 in August. It so, it would still be above the cycle low of 53.7 in July. Looking back to the last recession scare, ISM manufacturing PMI fell below 50 back in October 2015 and stayed there until March 2016. The low was 48.0 in January 2016 and US never went into recession. During that period, non-manufacturing PMI fell from 58.0 in October 2015 to 53.8 in January and February 2016 before rebounding. While the manufacturing PMI drop is worrisome, the non-manufacturing and composite PMIs are still well above the levels we saw during the economic slowdown in late 2015/early 2016. Our broad macro calls will be tested over the next two weeks with another big data dump for the US. Besides ISM, we get auto sales later today (17.0 mln expected), jobs data this Friday (147k expected), PPI on October 8 (2.1% y/y core expected), CPI on October 10 (2.4% y/y core expected), and retail sales October 16 (0.2% m/m expected). The US economy remains solid. The Atlanta Fed’s GDPNow model is tracking 2.1% SAAR growth in Q3, up from 1.9% previously, which is around trend (~2%) with no drop-off from 2.0% in Q2. Elsewhere, the NY Fed’s Nowcast model is tracking 2.1% SAAR growth in Q3, down from 2.2% previously. Its forecast for Q4 growth is now 1.8% SAAR, down from 2.0% previously. |
Chicago Fed National Activity Index, 2012-2019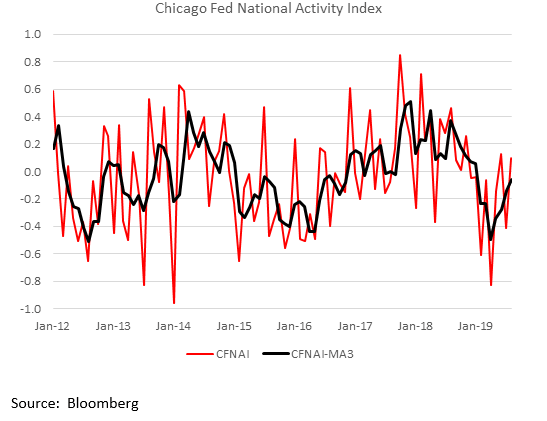 - Click to enlarge |
This momentum should be sustained into 2020, though we expect some downward revisions after the weak ISM data today.
Of the upcoming data, we believe retail sales will be the most important. The firm labor market has helped sustain consumption this year. If US firms try to pass on the higher tariff costs on to consumers, then retail sales are likely to suffer, as will overall GDP growth.
We believe the Chicago Fed National Activity Index (CFNAI) remains the single best indicator to gauge US recession risks. CFNAI came in better than expected at 0.10 for August. Even though July was revised down to -0.41, the 3-month moving average (CFNAI-MA3) still fell to -0.06 from -0.14 in July, the lowest since January. Note that a value of zero shows an economy growing at trend. Positive values represent above trend growth, while negative values represent below trend growth. The Chicago Fed has shown that -0.7 is a reliable threshold for CFNAI-MA3 that signals recession. For now, it appears that the US is moving further away from recession and market expectations for the Fed need to be adjusted significantly.
The 3-month to 10-year curve inversion has eased, signaling lower perceived recession risk. At -6 bp earlier today, the inversion was the least since mid-September. It has since inverted back to -15 bp after the ISM data. Using the shape of the US yield curve, the New York Fed calculates the probability of a US recession 12 months ahead. This rose to a cycle high 37.93% in August from 31.5% in July, the highest since March 2008. Given the reduced inversion last month, we expect the odds to move back below 35% in September.
INVESTMENT OUTLOOK
We continue to think that the US economy is in better shape than most appreciate, and that underpins our strong dollar call. Before the ISM data, we saw new highs in DXY today for this move. Over the past several months, the dollar has weakened after a big US data miss, only to come roaring back later. We expect that to happen again. WIRP is now showing 61% odds of a cut October 30, up from 40% yesterday. Given our constructive outlook for the US economy, this seems too high. When market expectations adjust, the dollar should continue to strengthen.
Let’s talk about duration and magnitude. Duration? We think the strong dollar call is good for well into 2020. The US economy has good momentum going into 2020. Magnitude? Next near-term targets for DXY are the May 2017 high near 99.888 and then the April 2017 high near 101.34. Looking further out, I think we make a run at the January 2017 high near 103.82. This translates roughly into a near-term (Q4) target of $1.0840 for the euro and medium-term (Q1) target of the February 2017 low near $1.05.
What could derail our call? Plain and simple, a US recession. That’s why the trade war remains our biggest worry. We think the economy can weather the political uncertainty, but the tariffs could choke off consumption. We need to watch this closely, as another slug of tariffs just hit September 1, and more are due in October and again in mid-December.
Until we get confirmation that the US is facing imminent recession risk, we are sticking with our broad macro calls. These include a stronger dollar, higher equities, and a bearish steepening of bond yields. These calls were coming to fruition during the summer, but the renewed tariff threats led to a huge reset across all markets. Our calls hinge critically on our view that the trade war will not trigger a US recession this year. These calls will be tested time and again and we expect heightened volatility across all markets to continue in the coming months.
The data remain key. If the outlook changes and the economy slows significantly or goes into recession, then the Fed will have no choice but to adjust its expected rate path significantly lower and we would have to revisit our bullish dollar call. For now, we think the rates markets are getting too negative once again.
The WTO cut its outlook for global trade to the weakest in a decade. It sees world trade volume rising 1.2% this year and 2.7% next year, both down from 3% in 2018. The forecasts were cut significantly from its April projections of 2.6% and 3.0%, respectively. WTO blamed the trade war and warned that further rounds of tariffs could spark a “destructive cycle of recrimination.”
This is very negative for EM, to state the obvious. The renewed trade tensions and broad-based risk off sentiment have conspired against EM FX and equities. These drivers will carry over into this quarter and so we remain bearish on EM. MSCI EM made a new low for this move near 957 back in August before seeing a bounce. The rally has run out of steam and so we think it is back on track to test the January low near 945.50 and then the October 2018 low near 930. Likewise, MSCI EM FX just made a new low for this move today near 1587 before bouncing. It is moving lower and is back on track to test the September 2018 low near 1575.
Tags: Articles,developed markets,Emerging Markets,Featured,newsletter