Monetary policy in 2018 is all about the Phillips curve. The extent to which wage growth and inflation respond to falling unemployment will shape the monetary tightening cycle. If recent price action is any guide, any surprise on that front could result in market overreaction and volatility spikes. The most elegant description of the current state of research was provided by ECB Executive Board member Benoît Coeuré last year, who described the Phillips curve as “flatter, non-linear or mis-specified in terms of the relevant economic slack”. Coeuré added that central bankers needed to be patient and humble as “technological and structural changes are affecting the way the labour market functions in ways we don’t yet
Topics:
Frederik Ducrozet considers the following as important: Featured, Macroview, newslettersent, philips curve, Pictet Macro Analysis, Swiss and European Macro
This could be interesting, too:
Nachrichten Ticker - www.finanzen.ch writes Die Performance der Kryptowährungen in KW 9: Das hat sich bei Bitcoin, Ether & Co. getan
Nachrichten Ticker - www.finanzen.ch writes Wer verbirgt sich hinter der Ethereum-Technologie?
Marc Chandler writes March 2025 Monthly
Mark Thornton writes Is Amazon a Union-Busting Leviathan?
| Monetary policy in 2018 is all about the Phillips curve. The extent to which wage growth and inflation respond to falling unemployment will shape the monetary tightening cycle. If recent price action is any guide, any surprise on that front could result in market overreaction and volatility spikes.
The most elegant description of the current state of research was provided by ECB Executive Board member Benoît Coeuré last year, who described the Phillips curve as “flatter, non-linear or mis-specified in terms of the relevant economic slack”. Coeuré added that central bankers needed to be patient and humble as “technological and structural changes are affecting the way the labour market functions in ways we don’t yet fully understand ”. Put simply, there are indeed two main categories of drivers of a flatter Phillips curve in the post-crisis world: global factors (including globalisation and innovation) and structural changes in the labour market (including hysteresis). In this note, we focus on the ECB’s preferred explanation. Measures of underemployment including workers marginally attached to the labour market (U6 rate s) have been used to improve the explanatory power of classic Phillips curve models. Our results suggest that the ongoing decline in broad unemployment is consistent with a rebound in euro area core inflation, to around 1.5% in the next 12-18 months. The recent weakness in core inflation, down to 0.9% y-o-y in Q4 2017, does not seem justified by fundamentals. However, we remain sceptical that labour underutilisation is the alpha and omega of wage and price setting mechanisms. Our analysis identifies cross-country heterogeneity as another important factor. |
Euro Area Underlying Inflation, 2010 - 2018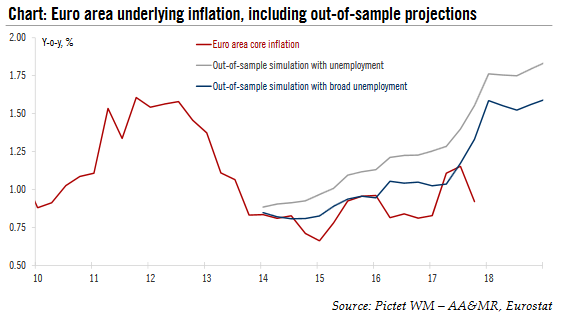 - Click to enlarge |
| The Phillips curve has been at the centre of economic debates in recent years because of an apparent conundrum. Following the Global Financial Crisis, most developed economies faced a so-called ‘missing deflation’ episode when a very large and abrupt widening in output gaps did not result in a proportional decline in inflation rates. Symmetrically, after several years of economic recovery and falling unemployment , inflation and wages have failed to respond to the rise in the rate of capacity utilisation, however gradual and subpar – a so-called ‘inflation puzzle’.
Two broad categories of explanations have been brought forward. On the one hand, persistent disinflationary pressures could be the result of global factors, boiling down to globalisation, digitalisation and broader technological changes. Claudio Borio, Head of the Monetary and Economic Department of the BIS, provided a comprehensive assessment of global deflationary forces and the implications for monetary policy. While acknowledging the importance of global factors 2, the ECB has repeatedly indicated that domestic factors continued to have a significant influence on inflation. Mario Draghi also said that the ECB saw“not much evidence” that e-commerce was depressing euro area inflation. On the other hand, the main domestic driver of a flatter, non-linear Phillips curve appears to be linked to structural changes in the labour market, including involuntary part-time contracts or the lower quality of new job openings relative to insider jobs. The ECB has put a great deal of emphasis on this set of structural factors, including during the Sintra forum in 2015, or more recently in Benoît Coeuré’s “Scars or scratches” seminal speech in May 2017. Meanwhile in the US, the situation is different but there is empirical evidence that the Phillips curve still holds when accounting for structural changes in labour market flows, controlling for the decline in the participation rate and the fact that people entering the labour market tend to earn less than the average worker, especially after a severe recession and against the backdrop of ageing demographics. After years of academic debates, 2018 could be the Make–or-Break year for the Phillips curve. Following years of anaemic wage growth, early signs of a larger increase would likely result in faster monetary tightening and a corresponding large re-pricing in financial markets. Against this backdrop, we take another look at labour underutilisation and wage dynamics in the euro area, revisiting and challenging the ECB’s hypothesis. Simple is beautifulThe ‘broad unemployment ’ hypothesis is intellectually seducing because it provides an intuitive explanation for larger economic slack and lower inflation in the post-GFC era than standard models would imply. Changing just one variable in the Phillips curve equation – total labour underutilisation instead of the headline unemployment rate – helps improve the explanatory and predictive power of most inflation models. This set of euro area labour market conditions is published by Eurostat on a quarterly basis, including several metrics of underemployment which the ECB considers as a good proxy for labour market slack. The main underemployment series (U6) includes total unemployment as well as underemployed part-time workers (i.e. people working fewer hours than they would like), persons available for work but not seeking work, and persons seeking work but not immediately available. The euro area U6 dropped to 17.3% in Q3 2017, consistent with a steadily declining trend that started in early 2015 (see our Chart of the Week, 2 February 2018). Simple dot plot charts provide a useful star ting point, using both unemployment and broad unemployment against core inflation over the same period (2005-2017, due to data limitations in U6 rates). Although the slope of the linear regression looks flatter using broad unemployment, the relationships looks stronger with an adjusted R-square of 52% compared with 43% using standard unemployment. |
Phillips curves using unemployment and broad unemployment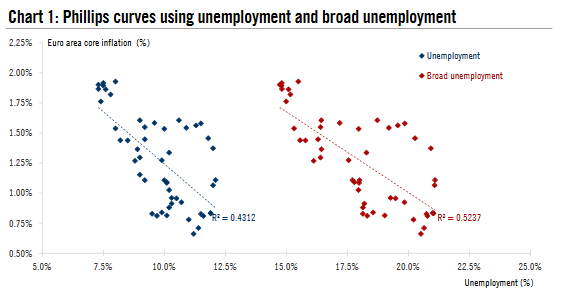 - Click to enlarge |
| More sophisticated models using different measures of underlying inflation (e.g., core inflation excluding taxes), or model specifications (including unconstrained anticipations-augmented Phillips curves) tend to confirm the higher predictive power of broad unemployment over standard unemployment. Note that independently from the relevant measure of labour market slack, there is a debate about the most appropriate Phillips curve specification, sometimes leading to conflicting conclusions.
Chart 2 below was used by Benoît Coeuré to make this point showing out-of-sample simulations of core inflation using broad unemployment relative to a wide range of models using standard unemployment. |
Underlying inflation, including out -of-sample projections, 2012 - 2016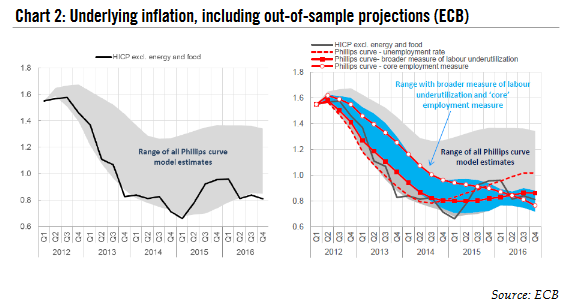 - Click to enlarge |
| Given that our purpose is to test the relative importance of U6 rates, we have tested a number of model specifications ourselves and the conclusion is broadly unchanged, although our results are indeed fairly sensitive to the model specification and the inflation gauges. Using a simple model with lagged values of core inflation and the import price deflator over 2005-17, the out-of-sample simulations in Chart 3 provide additional visual evidence of the relevance of the U6 rate which better captures core inflation dynamics since 2014. |
Underlying inflation, including out -of-sample projections, 2010 - 2018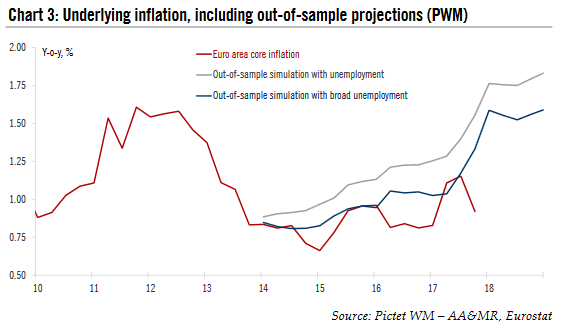 - Click to enlarge |
| The results from a wide range of models are consistent with the view that the ongoing decline in broad unemployment is consistent with a rebound in euro area core inflation, to around 1.5% in the next 12-18 months. The upward adjustment would be slightly faster than in our scenario (we forecast euro area core HICP inflation to hit 1.5% by the end of 2019).
Importantly, our results suggest that the recent weakness in core inflation, down to 0.9% y-o-y in Q4 2017, is not justified by fundamentals. Indeed core inflation failed to respond to a further broad-based decline in U6 rates, especially in France and in Italy (see below). It could be that the time lags will prove to be longer than usual. More likely, in our view, a number of exogenous and/or temporary factors have weighed on euro area core HICP inflation in Q4 2017 (including package holiday, air fares, education, or healthcare), and we need to look through the noise. This observation is very robust to changes in terms of model specification or the selection of variables, including a consistently large regression residual for core inflation in H2 2017 (see, for instance, Chart 4 with a dynamic fit based on another simple Banque de France model using the European Commission ’s estimate for the euro area output gap as well as the import price deflator). |
Core inflation projections in a simple, dynamic Phillips curve model, 1999 - 2018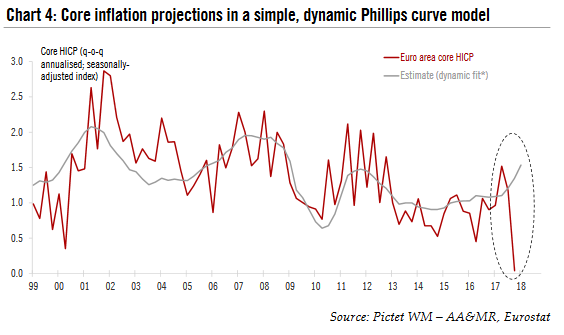 - Click to enlarge |
Too good to be true? Reality is more complicated, but the conclusion broadly holdsIn short, our results tend to confirm the ECB’s view that measures of labour underutilisation help better capture the dynamics of euro area core inflation than standard unemployment rates. However, we suspect that broad unemployment is not the single explanation for a flatter Phillips curve due to a number of limitations and possible misspecifications.
Our national Phillips curve simulations using output gaps and unemployment gaps as proxies for slack (with European Commission’s estimates for potential growth and the Non-accelerating-inflation-rate of unemployment, or NAIRU) suggest that the dispersion in the slope of the curve across countries has increased in recent years (Chart 5). |
Dispersion of the slope of national Phillips curves, 2003 - 2018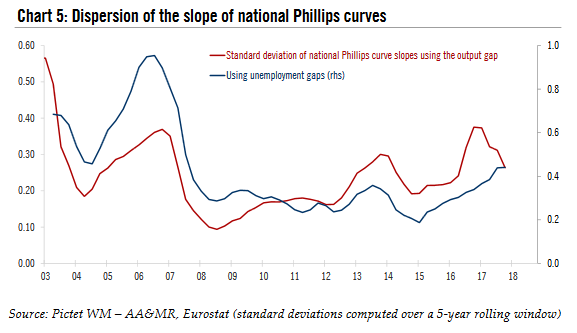 - Click to enlarge |
|
The same conclusion holds using broad unemployment, although the shorter history further reduces the window over which rolling estimates can be computed. A simple dot plot chart with national U6 rates and core inflation reflects this wide dispersion in national Phillips curve (Chart 6). The slope appears to be steeper on average in France and Italy, although it has flattened significantly in recent quarters, as core inflation failed to respond to lower U6 rates. It could be because the transmission will take longer than usual, or because of exogenous factors (e.g., changes in ad ministrated prices), or both. Either way, the changing dynamics in national Phillips curves suggests that additional factors are at play.
|
U6 national Phillips curves using broad unemployment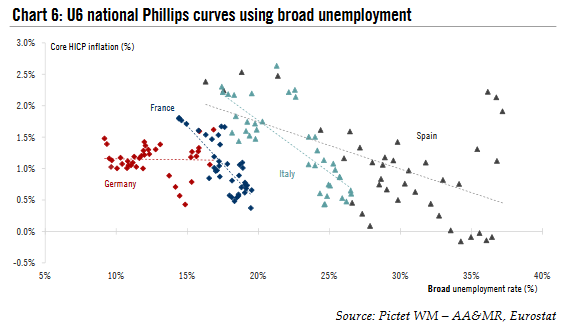 - Click to enlarge |
In conclusion, we find evidence in favour of the labour underutilisation (or road unemployment) hypothesis, consistent with the ECB’s view that wage growth will rise and inflation will eventually converge towards its 2% target. But, we are not fully convinced. Empirical results remain fairly sensitive to model specification and the measure of inflation. Moreover, most models seem to break down to some extent in H2 2017. Instead, we find evidence that cross-country heterogeneity has increased so that the average slack may fail to capture structural changes at the national level. At the very least, other factors are likely to play a role, possibly reflecting interconnected (disinflationary) effects and missing variables. More than ever, a patient ECB should wait until it sees the ‘whites of the eyes’ of core inflation.
Tags: Featured,Macroview,newslettersent,philips curve