Copper prices behave more deliberately than perhaps prices in other commodity markets. Like gold, it is still set by a mix of economic (meaning physical) and financial (meaning collateral and financing). Unlike gold, there doesn’t seem to be any rush to get to wherever the commodity market is going. Over the last several years, it has been more long periods of sideways. That’s what makes any potential breakout noteworthy. Dr. Copper’s place in the hierarchy is already assured because of its lengthy history of closely mirroring impending economic conditions. When the dollar started “rising” last April and May, it was copper a few months later which ended up confirming the negative signal; or, more precisely, the growing perceptions that a renewed, sharp dollar
Topics:
Jeffrey P. Snider considers the following as important: 5.) Alhambra Investments, 5) Global Macro, China, China Manufacturing PMI, china nbs manufacturing pmi, china nbs non-manufacturing pmi, commodities, Copper, currencies, economy, Featured, Federal Reserve/Monetary Policy, global trade, manufacturing, Markets, NBS, newsletter, non-manufacturing, PMI
This could be interesting, too:
Nachrichten Ticker - www.finanzen.ch writes Die Performance der Kryptowährungen in KW 9: Das hat sich bei Bitcoin, Ether & Co. getan
Nachrichten Ticker - www.finanzen.ch writes Wer verbirgt sich hinter der Ethereum-Technologie?
Martin Hartmann writes Eine Analyse nach den Lehren von Milton Friedman
Marc Chandler writes March 2025 Monthly
| Copper prices behave more deliberately than perhaps prices in other commodity markets. Like gold, it is still set by a mix of economic (meaning physical) and financial (meaning collateral and financing). Unlike gold, there doesn’t seem to be any rush to get to wherever the commodity market is going. Over the last several years, it has been more long periods of sideways.
That’s what makes any potential breakout noteworthy. Dr. Copper’s place in the hierarchy is already assured because of its lengthy history of closely mirroring impending economic conditions. When the dollar started “rising” last April and May, it was copper a few months later which ended up confirming the negative signal; or, more precisely, the growing perceptions that a renewed, sharp dollar shortage would almost certainly damage the global economy. I wrote early last May:
|
Copper NBS, August 2016 - 2019 |
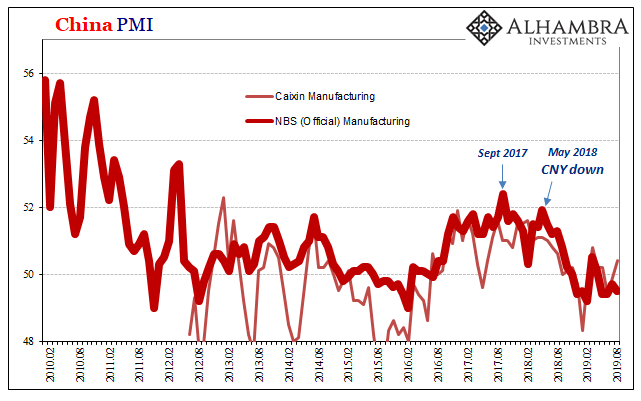
| “Dollar” issues have really resurfaced and have been stubborn about it, especially as they may relate to China’s participation in the eurodollar system. Then there was the 19th Communist Party Congress that, for the unbiased, dispelled any official notion of future acceleration. In many ways, the Communists were careful in announcing a worldwide “L” – and then have so far lived up to it.
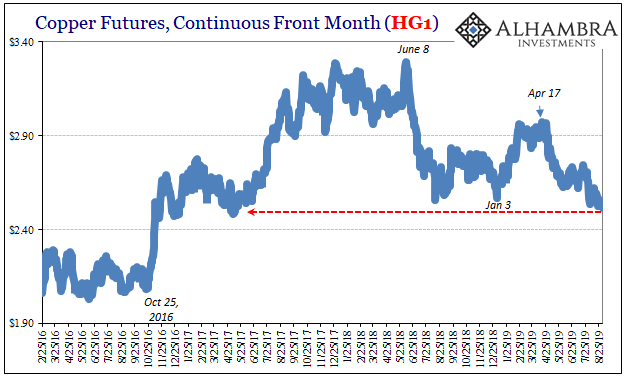
Not trade wars but the repeat of the singular global problem. In April and May 2018, there was the dollar again signaling the shortage confirmed on the financing end by the bond market (May 29). In June immediately following, after a huge supply-side head fake higher, copper joined in on the downside in a big way. That trend was tested in the immediately aftermath of last year’s landmine. While curves continued to collapse after January 3, 2019, copper moved toward the high side, failing to break lower. For several months it carried with it almost all of the hopes for “green shoots.” Copper back in the reflation column would be a significant sign of the resilient economy Jay Powell has been talking about all this year. Following April 17, however, the it has moved toward the lows. Only recently, though, has the price broken out on the downside; effectively falling out of a range that had persisted for a year. In trading today, copper really plunged at the open; HG1 (the front month futures price) slammed as low as $2.46 and what would’ve been the lowest price since October 2016. Even though copper recovered throughout the rest of the day, it would still close down sharply at $2.5125 – and still significant at the lowest price since early 2017. There were several reasons for the sharp selloff in the pits. Though it was this way in the bond market, it wasn’t actually the ISM falling below 50 which had triggered the commodity. A manufacturing downturn maybe even a recession in the US would be negative on the physicals as well as financials for copper. The ISM wasn’t the catalyst, however. Copper had traded lower before that news came out earlier today. The Chinese had beaten everyone to the punch late Friday night. China’s National Bureau of Statistics had announced its own PMI figures for the month of August. As you might imagine from nothing more than the implications of Dr. Copper, they weren’t good. |
|
| The official manufacturing PMI fell back to 49.5 last month from 49.7 during July. It was the fourth straight month less than fifty, and the seventh out of the last nine. These sub-50 PMI numbers are becoming equivalent to some of the lowest growth levels in modern industrial China’s history (the IP estimate for July 2019 was effectively the lowest on record).
In other words, the PMI together with where IP has been signals that China isn’t turning around anytime soon and also that it probably hasn’t yet hit bottom. Slowing down maybe even outright contraction in industry surpasses the alarming downturn in 2014-16. |
Copper NBS and China Manufacturing PMI, February 2010 - August 2019(see more posts on China Manufacturing PMI, ) |
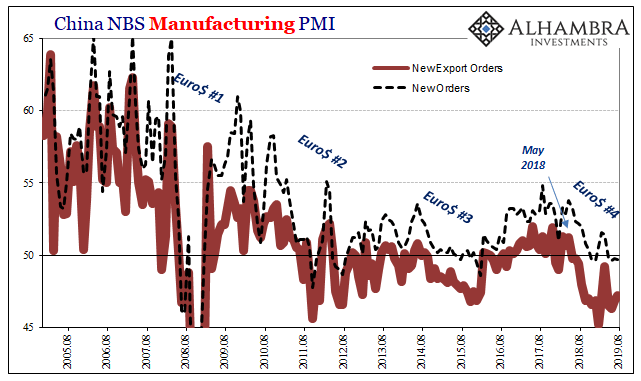
| It’s easy to blame trade wars for the deterioration, and export orders continue to decline, but it is as much internal as external weakness. Total new orders have been below 50 each of the past four months, too. Therefore, it can’t be that Chinese strength is offsetting tariff-driven external weakness; it is all bad in all corners.
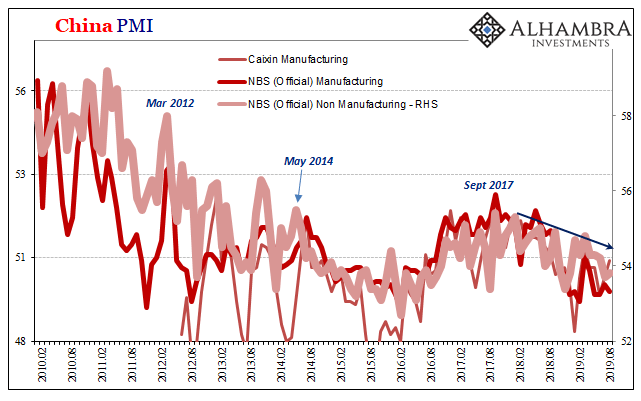
That’s exactly the sentiment of the NBS’s non-manufacturing PMI. Continuing its off-month pattern, July’s estimate set a lower point on the downside; the number for August barely improved from it. The prior month had already been down sharply from the middle of the year, falling then to 53.7. |
China Copper NBS Manufacturing Orders, August 2005 - 2019 |
| As of the latest update for August, the non-manufacturing PMI gained the smallest possible amount – just +0.1 to 53.8.
Again, broad-based Chinese weakness that is still going in the wrong direction. Entrenched lower growth, maybe even the hint of the “hard landing” scenario, these would certainly weigh on copper to the point for much of the day it was trading like it was 2016 all over again. It wouldn’t be as much of an issue if like 2016 this was all coming at the end of the (eurodollar) process rather than closer to its beginning. We’re starting to see a lot that matches the worst of Euro$ #3 only this one, number four, is still in its early stages. Copper confirmed. |
China Copper NBS Non-Manufacturing PMI, February 2010 - August 2019(see more posts on China Non-Manufacturing PMI, ) |
Tags: China,China Manufacturing PMI,china nbs manufacturing pmi,china nbs non-manufacturing pmi,commodities,Copper,currencies,economy,Featured,Federal Reserve/Monetary Policy,global trade,manufacturing,Markets,NBS,newsletter,non-manufacturing,PMI


