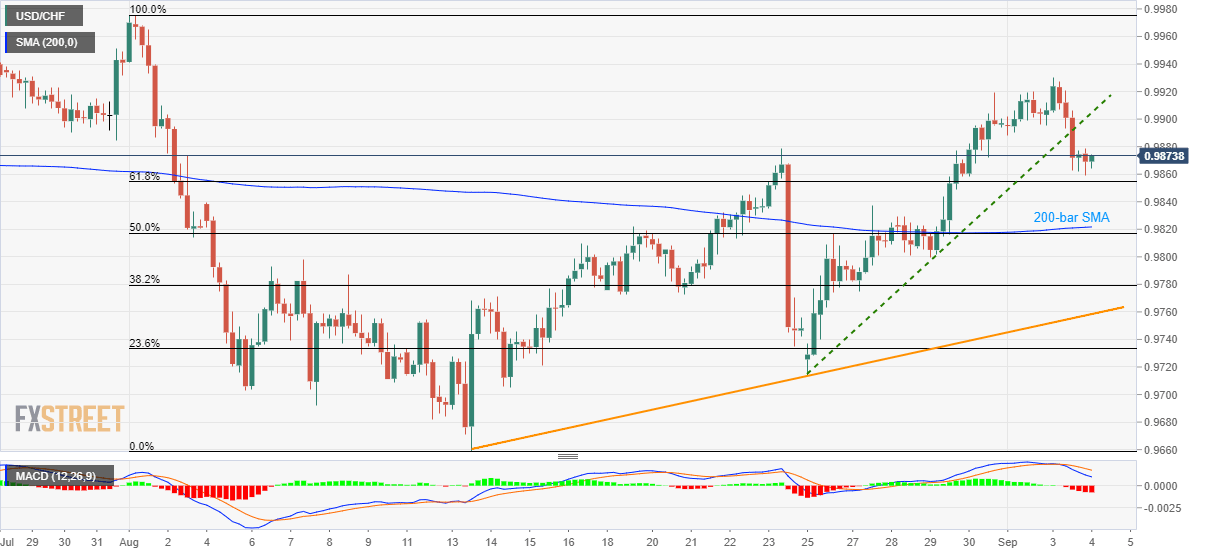
USD/CHF extends declines on the break of one-week-old support-line (now resistance). Sellers look for key technical levels amid bearish signals from MACD. Following its break of immediate support-line, the USD/CHF pair remains on the back foot while taking rounds to 0.9870 amid Wednesday’s Asian session. Sellers now aim for 61.8% Fibonacci retracement level of August month downpour, at 0.9854, as immediate support ahead of targeting 0.9822/17 confluence including 200-bar simple moving average (SMA) and 50% Fibonacci retracement level. In a case prices slip beneath 0.9817, 38.2% Fibonacci retracement of 0.9780 may offer an intermediate halt to the south-run towards three-week-long rising trend-line close to 0.9760. Adding to the sellers’ favor is a bearish signal
Topics:
Anil Panchal considers the following as important: 4.) FXStreet, 4) FX Trends, Featured, newsletter, USD/CHF
This could be interesting, too:
Nachrichten Ticker - www.finanzen.ch writes Die Performance der Kryptowährungen in KW 9: Das hat sich bei Bitcoin, Ether & Co. getan
Nachrichten Ticker - www.finanzen.ch writes Wer verbirgt sich hinter der Ethereum-Technologie?
Martin Hartmann writes Eine Analyse nach den Lehren von Milton Friedman
Marc Chandler writes March 2025 Monthly
Following its break of immediate support-line, the USD/CHF pair remains on the back foot while taking rounds to 0.9870 amid Wednesday’s Asian session. Sellers now aim for 61.8% Fibonacci retracement level of August month downpour, at 0.9854, as immediate support ahead of targeting 0.9822/17 confluence including 200-bar simple moving average (SMA) and 50% Fibonacci retracement level. In a case prices slip beneath 0.9817, 38.2% Fibonacci retracement of 0.9780 may offer an intermediate halt to the south-run towards three-week-long rising trend-line close to 0.9760. Adding to the sellers’ favor is a bearish signal from the 12-bar moving average convergence and divergence (MACD) indicator. Alternatively, Monday’s low near 0.9890 and Tuesday’s top surrounding 0.9930 can offer immediate resistance to the pair, a break of which can escalate the run-up towards August month high surrounding 0.9980. |
USD/CHF 4-hour Chart(see more posts on USD/CHF, ) |
Trend: pullback expected
Tags: Featured,newsletter,USD/CHF

